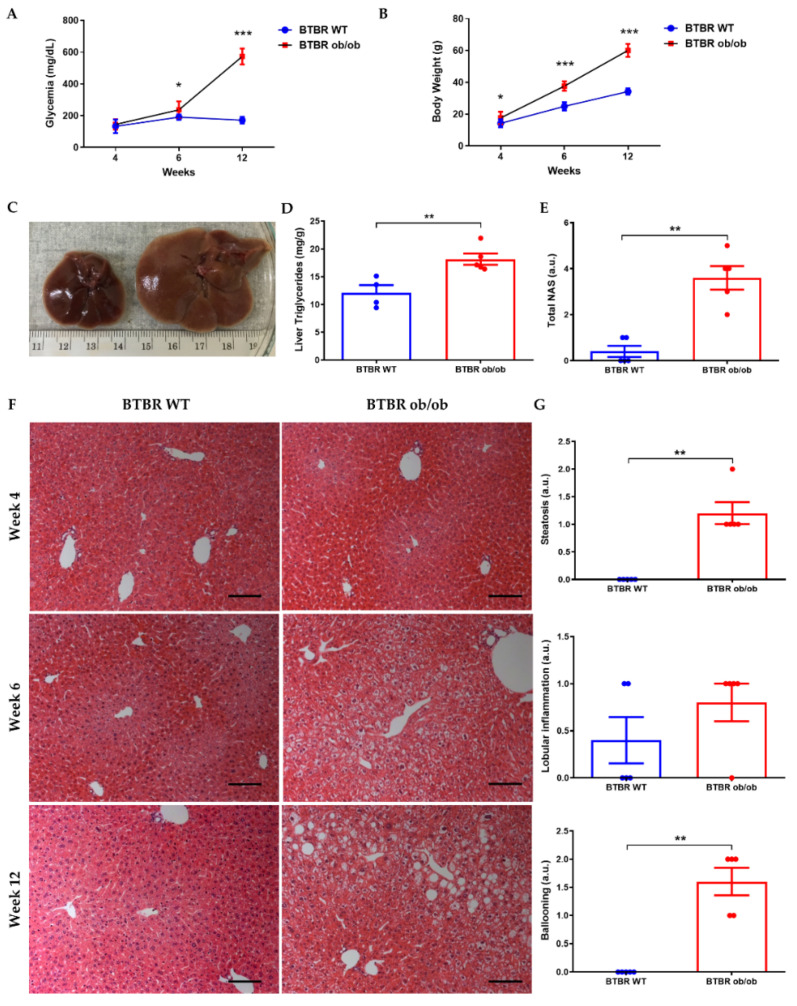
Figure 1.
Progression of liver steatosis from weeks 4 to 12. Non-fasting glycemia (A) and body weight (B) of BTBR WT and BTBR ob/ob mice at 4, 6 and 12 weeks. (C) Macroscopic photograph of liver at 12 weeks in BTBR WT (left) and BTBR ob/ob mice (right). (D) Measurement of liver TGs at 12 weeks. (E) NAFLD activity score (NAS) assessment at 12 weeks (F) Representative H-E images of livers of BTBR WT (left) and BTBR ob/ob mice (right) showing steatosis progression (magnification 100×) from 4–12 weeks. (G) Semi-quantitative determination of steatosis, lobular inflammation and hepatocytes ballooning in livers of mice at 12 weeks. Data are shown as scatter dot plots and mean ± SEM of each group (n = 5–6 mice/group); * p < 0.05, ** p < 0.01, *** p < 0.001 vs. BTBR WT. Abbreviations: NAS: NAFLD activity score; a.u: arbitrary units.

