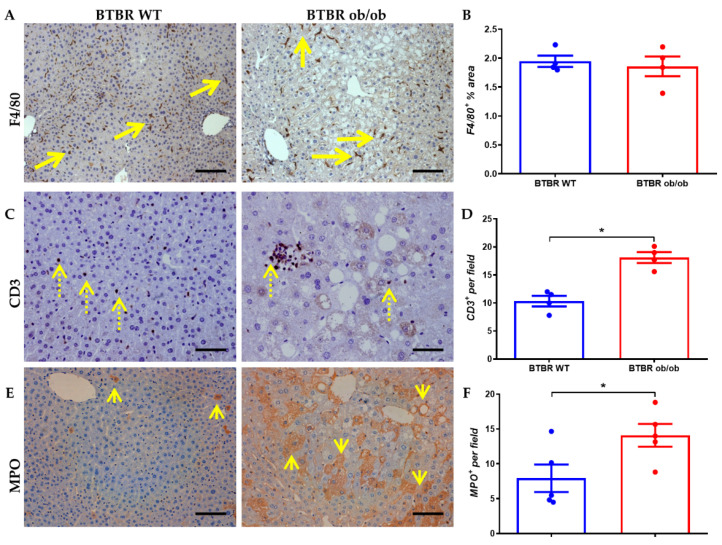
Figure 2.
Inflammatory infiltrate in BTBR WT (left) and BTBR ob/ob mice (right) at 12 weeks. (A) Representative image of monocytes/macrophages infiltration (F4/80+ staining; long arrow) (magnification 100×), and F4/80+ area quantification (B). (C) Representative image (of lymphocytes T (CD3; dotted arrow) staining (magnification 200×) and its quantification (D). (E) Myeloperoxidase (MPO; short arrow) immunostaining (magnification 200×) and quantification of the positive cells per field (F). Data are shown as scatter dot plots and mean ± SEM of each group (n = 5 mice/group); * p < 0.05 vs. BTBR WT.

