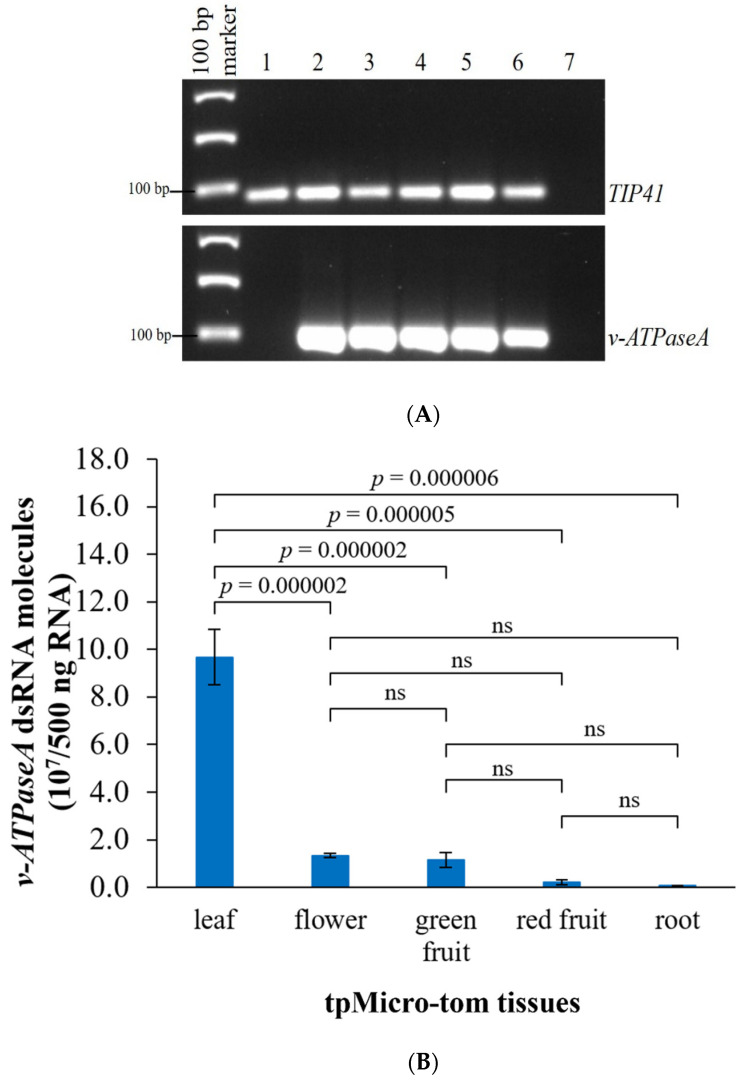
Figure 3.
dsRNA production in different tpMicro-tom tissues. (A) Qualitative assessment of dsRNA production using end-point PCR and agarose gel that show dsRNA presence in various tpMicro-tom tissues; Lane 1 = WT leaf; Lane 2 = transplastomic (tp) leaf; Lane 3 = tp flower; Lane 4 = tp green fruit; Lane 5 = tp red fruit; Lane 6 = tp root; and Lane 7 = no template control. (B) Absolute quantification of v-ATPaseA dsRNA molecules in 500 ng tpMicro-tom total RNA using ddPCR. Data are expressed as mean quantity ± SEM, n = 3. p-values were calculated using Tukey’s HSD (one-way ANOVA) for each comparison and are indicated on the graph. “ns” = not significant (p > 0.05) according to the Tukey’s HSD test.

