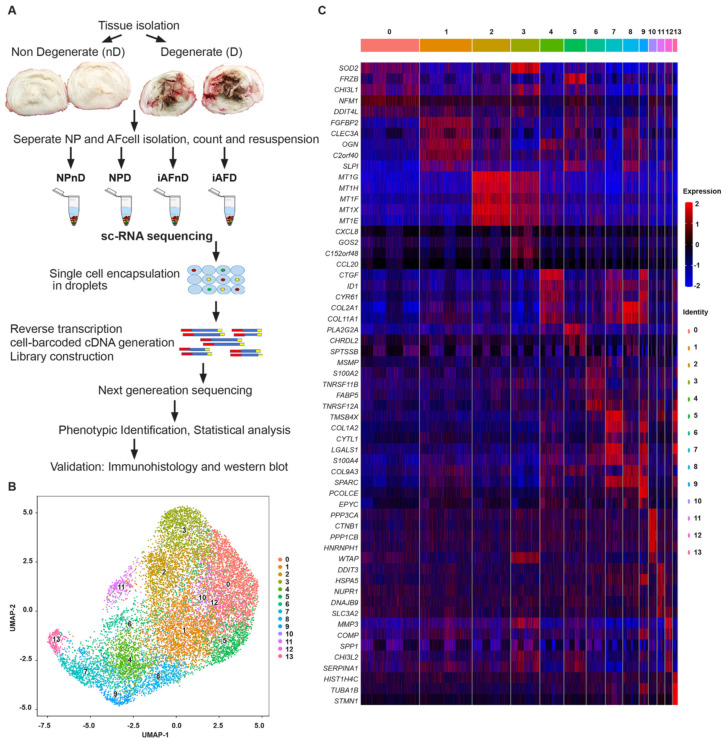
Figure 1.
Single-cell RNA sequencing reveals heterogeneity of the human disc cells. (A) Schematic overview of the workflow of isolating and analyzing iAF and NP cells from human non-degenerating (nD) and degenerating (D) discs. (B) UMAP plot showing the unbiased classification of 3.131 iAFnD, 3.867 NPnD, 3.092 iAFD and 3.646 NPD. Cells are clustered according to transcriptome similarity in 2D space. Each dot represents one cell, colored by cluster. UMAP plot revealed that cells in the human disc are present in 14 unique clusters (0–13). (C) Heat map showing the top marker genes of each cluster (0–13) as determined by Seurat analysis. Expression of genes is represented using a z-score value in which red indicates higher expression and blue indicates lower expression.

