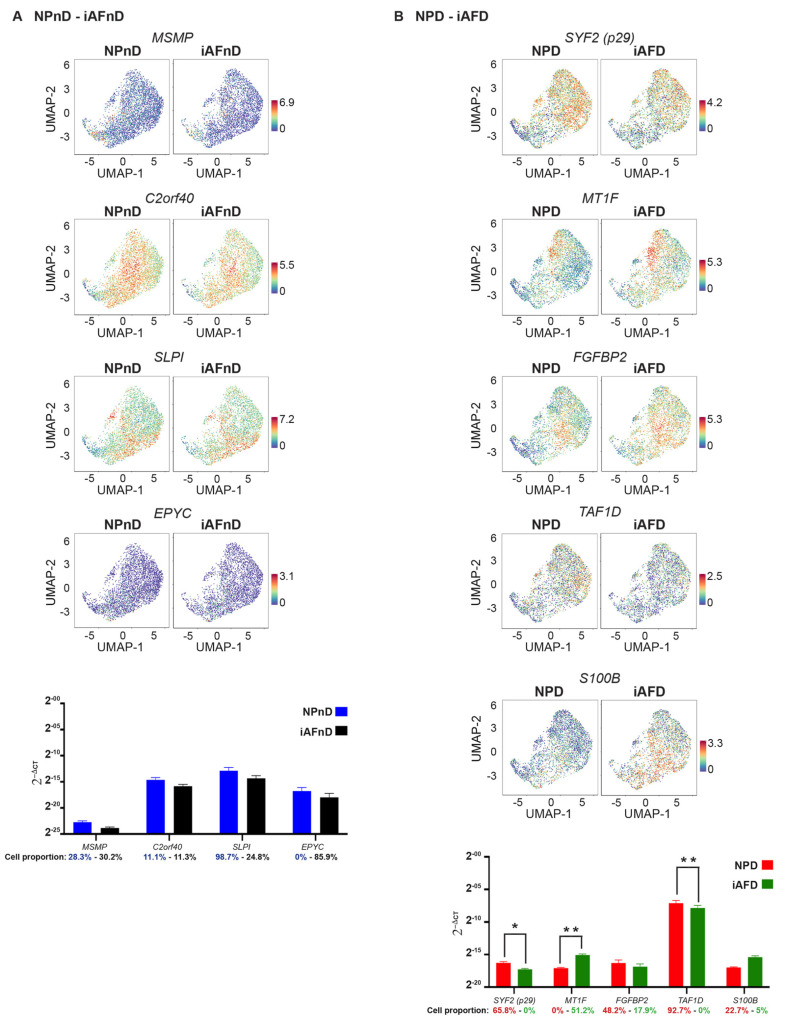
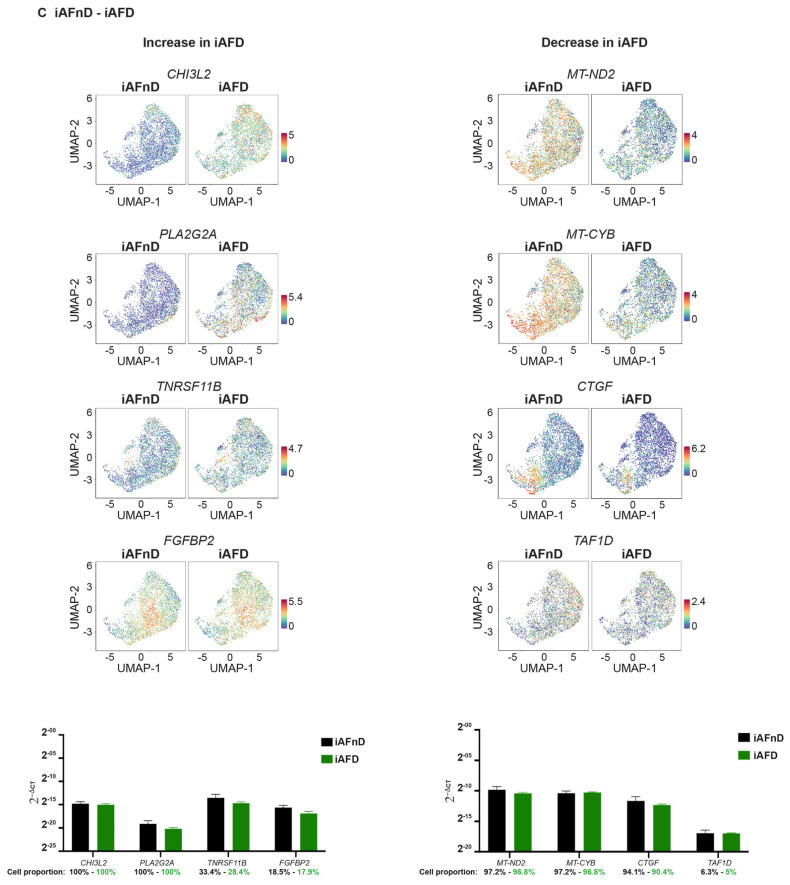
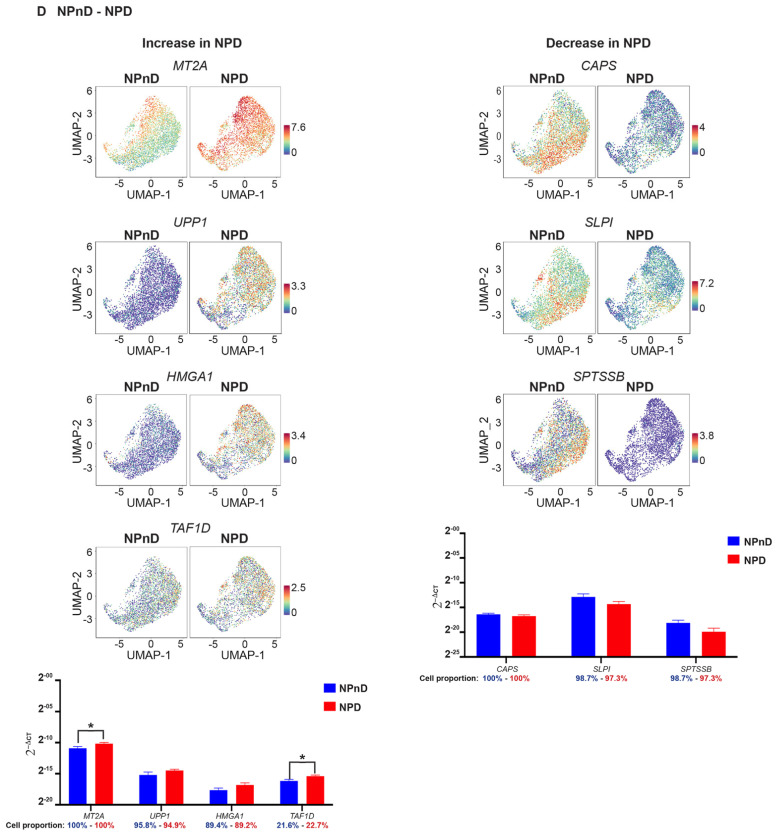
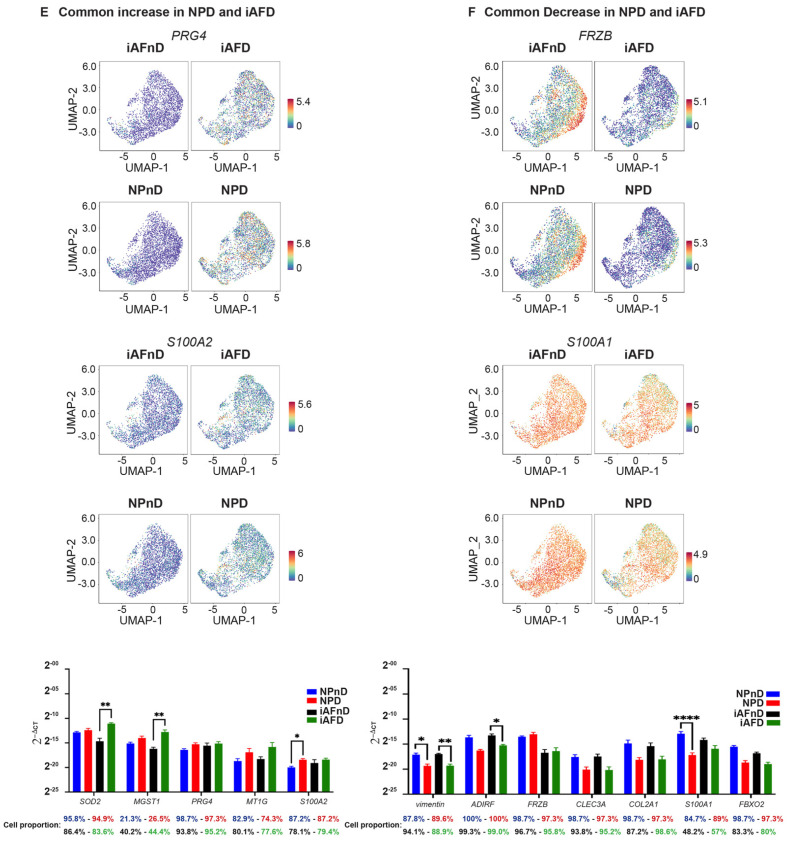
Figure 6.
RT-PCR validation of DEGs identified from transcriptome analysis. Representative UMAPs and graphs highlighting the gene expression differences of MSMP, C2orf40, SLPI and EPYC between NPnD and iAFnD in (A); SYF2, MT1F, FGFBP2, TAF1D and EPYC between NPD and iAFD in (B). RT-PCR validation of IVD degeneration selected DEGs in the transcriptome data of CHI3L2, PLA2G2A, TNRSF11B and FGFBP2 showing an increase or MT-ND2, MT-CYB, CTGF and TAF1D showing a decrease in iAFD (C) when compared to iAFnD cells from discs of the same individual. mRNA expression of MT2A, UPP1, HMGA1 and TAF1D (increase) and CAPS, SLPI and SPTSSB (decrease) in NPD compared with NPnD (D). Validation of common degeneration markers by RT-qPCR showing an increase or a decrease with degeneration NPD (E) and AFD (F). The values were calculated using the 2−∆∆Ct method: * p < 0.05, ** p < 0.01 and **** p < 0.0001.


