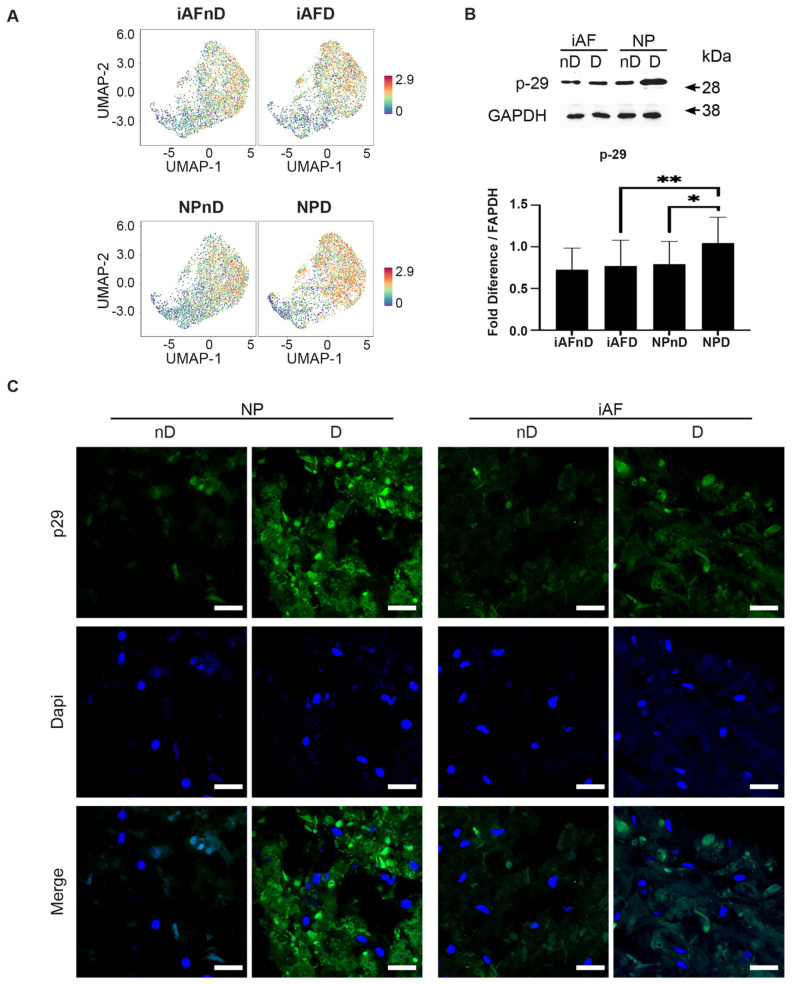
Figure 9.
Validation of selected cell type and degeneration markers. (A) UMAP highlighting p29 gene expression at the single-cell level in iAF and NP nD and D discs of the same individual. (B) Western Blot analysis of cell lysates from 5 additional individuals normalized to GAPDH (n = 5). (C) Immunohistochemistry staining of p29 (in green), Dapi (in blue) and merged images of cells from 5 additional individuals (scale = 100 µm, n = 5 biological replicates). Graphs are presented as mean ± SEM. * p < 0.05, ** p < 0.01.

