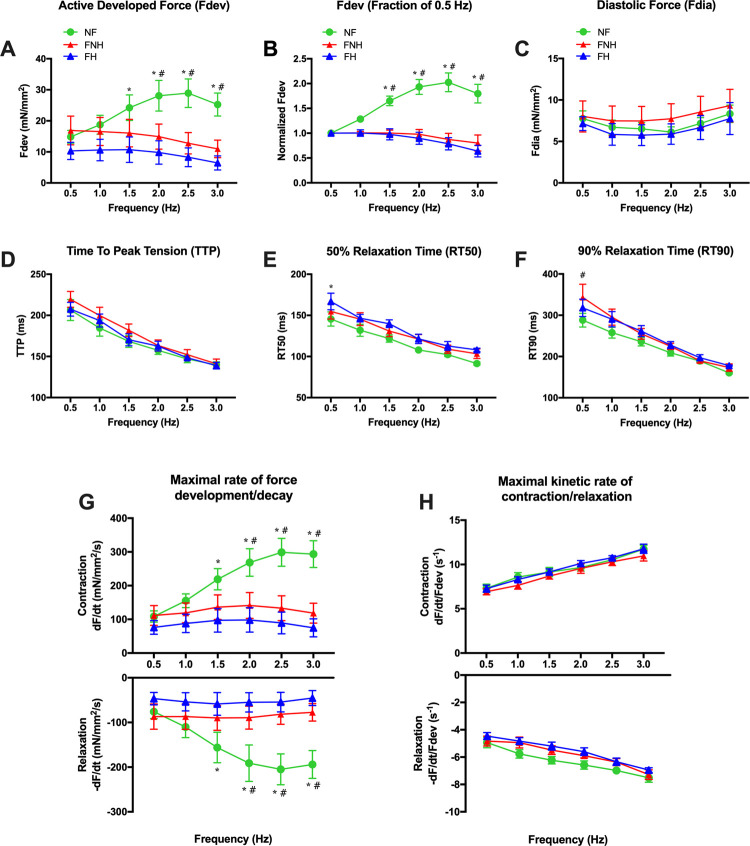
Fig 3. Frequency-dependent activation in NF trabeculae (n = 9) vs. failing trabeculae with no hypothyroidism (FNH; n = 9) and failing trabeculae with hypothyroidism (FH; n = 4).
(A) Frequency-dependent regulation of force was significantly different between trabeculae isolated from NF, FNH and FH hearts, where it was significantly positive in NF myocardium. (B) Same data as panel A, plotted to each muscle’s force at 0.5 Hz to allow equal weight of each muscle in the statistical analysis. At all frequencies, force in NF trabeculae exceeded the force at the 0.5 Hz baseline. (C) Fdia slightly declined at 1 and 2 Hz in NF and failing groups. In all groups, Fdia was higher at 3 Hz than that of 0.5 Hz. (D) TTP shortened upon increasing frequency of stimulation in all groups with no differences between NF and both failing groups at each respective frequency. (E) RT50 decreased as frequency increased from 0.5 Hz to 3 Hz in all three groups. (F) RT90 was not significantly different between the three groups at each respective frequency of stimulation and was shorter at higher frequency (3 Hz). (G) +dF/dt and -dF/dt were sped up in NF and failing groups as frequency increased and were significantly faster in NF group compared to both failing groups at 1.5–3 Hz. (H) +dF/dt/Fdev and -dF/dt/Fdev were faster in all groups over the entire frequency range. However, the acceleration of this kinetic rate was equal in all three groups. Data are depicted as means ± SEM; A two-way repeated measures ANOVA followed by Tukey’s post hoc test for multiple comparisons; * indicates P < 0.05 significant difference between NF and FH groups; # indicates P < 0.05 significant difference between NF and FNH groups at corresponding stimulation frequency. FFR, force-frequency relationship; other abbreviations as in Fig 1.

