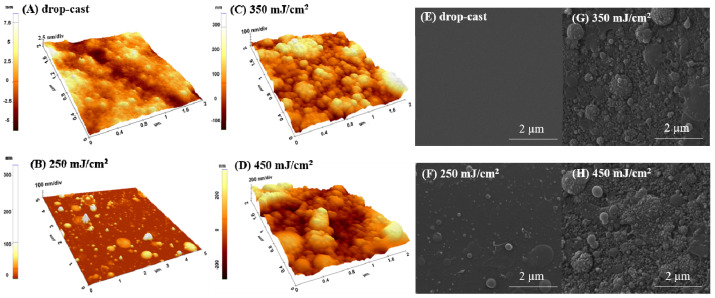
Figure 1.
AFM surface images (3D—left) and SEM micrographs (right) of p(NIPAM-BA) layers in water solvent obtained by drop-cast (A,E) and by MAPLE deposition at 250 mJ /cm2 (B,F), 350 mJ /cm2 (C,G), and 450 mJ/cm2 fluences (D,H). AFM images correspond to areas of 5 × 5 µm2 and 2 × 2 µm2. SEM magnifications 40,000×.

