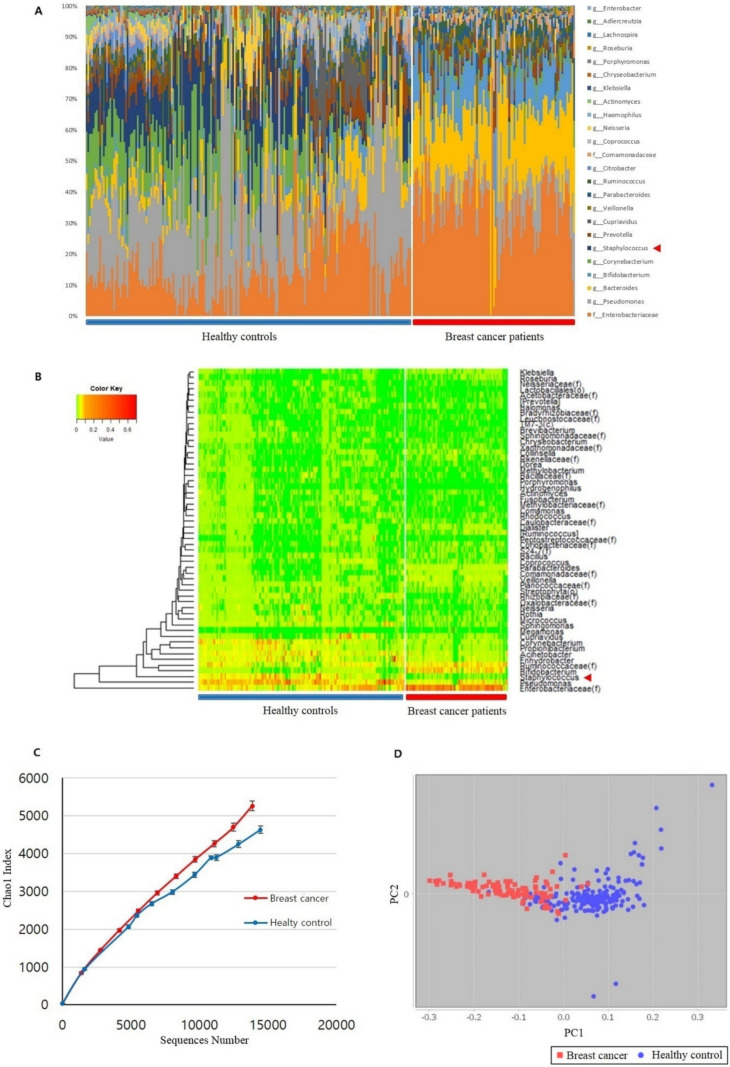
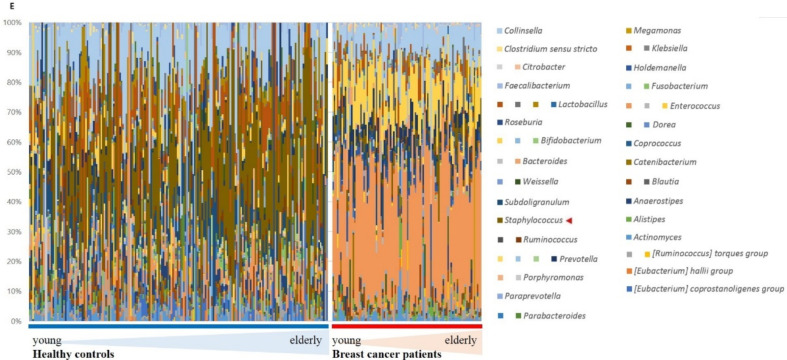
Figure 1.
Microbiome analysis of blood samples from patients with breast cancer and healthy controls. (A) Microbiome differences between patients with breast cancer and healthy controls at the genus level indicated by a histogram. The red arrowhead indicates Staphylococcus sp. (B) Heatmap of microbiome differences between patients with breast cancer and healthy controls. The red arrowhead points to Staphylococcus sp. (C) Alpha diversity analyzed through the Chao1 index between the breast cancer and healthy control groups. The red and blue lines represent the breast cancer group and the healthy control group, respectively. (D) Beta diversity analyzed through the principal component coordinate analysis (PCoA) in patients with breast cancer and healthy controls. PC1, principal component 1; PC2, principal component 2; red dot, breast cancer patients; blue dot, healthy controls. (E) Association of the blood microbiome with estrogen metabolism. The bar chart depicts the genus−level percentages of the microbiome in healthy controls and breast cancer patients. Data were averaged to select for bacteria abundant in more than 0.1% of the microbiota. Bacteria listed in Table 1 were selected, and only those with a p−value of 0.01 or less were selected for analyses.


