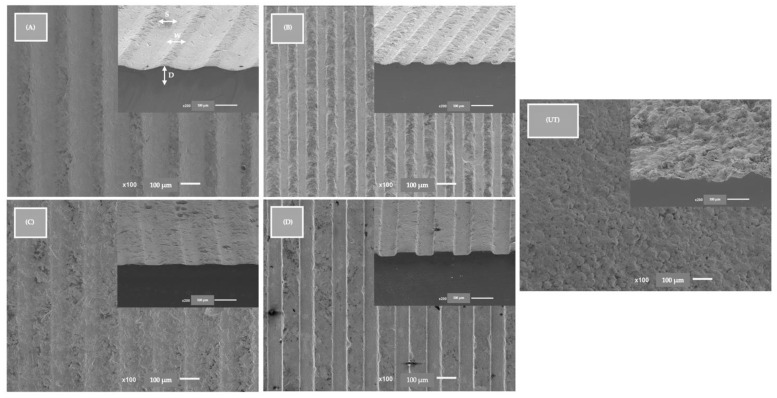
Figure 2.
FEG-SEM images after blasting and acid etching of all study groups. Images at 100× magnification and cross-sectional images at 100× magnification at the same 90° angle. D—depth, W—width, S—spacing. Groups (A–D) were textured with width-standardized milling microgroove and control group (UT) were only sandblasting and acid etching. The scale bars are 100 μm.

