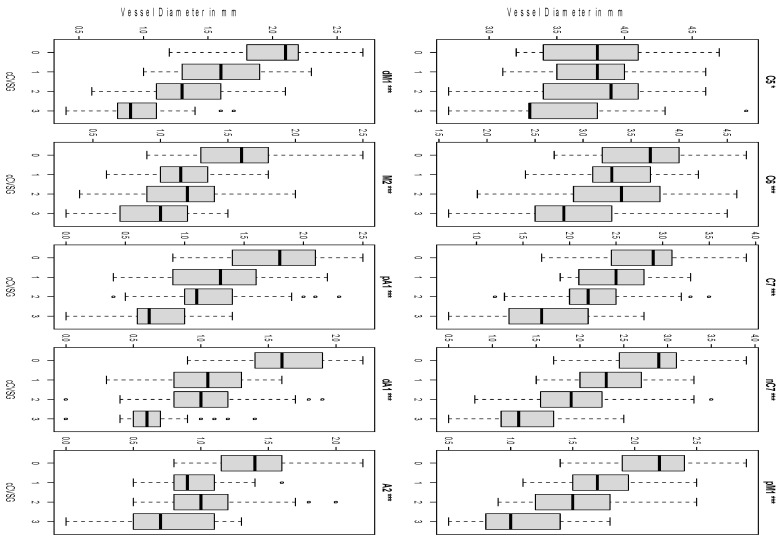
Figure 2.
Clustering of vessel diameters. The distribution of vessel diameters according to cCVSG 0–3 after mathematical clustering is shown. All vessel segments had a significant intergrade difference (* C5 p = 0.013, *** the remaining p < 0.001). Discordant values are shown as small circles C5 clinoid segment of the internal carotid artery, C6 ophthalmic segment of the internal carotid artery, C7 terminal segment of the internal carotid artery, nC7 narrowest point of C7, pM1 proximal horizontal segment of the middle cerebral artery, dM1 distal horizontal segment of the middle cerebral artery, M2 insular segment of the middle cerebral artery, pA1 proximal pre-communication segment of the anterior cerebral artery, dA1 distal pre-communication segment of the anterior cerebral artery, A2 post-communicating segment of the anterior cerebral artery. The small circles show the discordant values.

