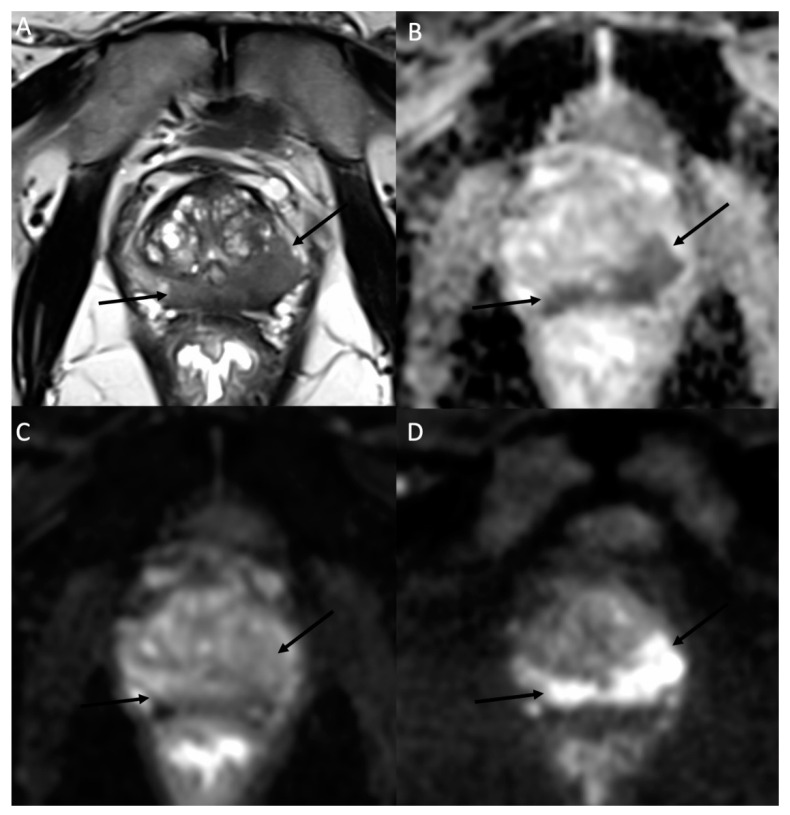
Figure 6.
MR images of a prostate MRI at 3T in a 78-year-old man with a 7.7 ng/mL PSA. (A) The axial T2W morphologic image shows a hypointense area (arrows) expanding in the peripheral zone of the prostatic parenchyma on both sides with a predominant tissular infiltration on the left side. (B) The corresponding ADC map obtained by fitting a monoexponential model using the b-50 (C) and b-1500 (D) images. As a typical example of high-grade prostate adenocarcinoma, the b-50 (C) to b-1500 (D) images show an increasing signal in the neoplastic tissue due to the diffusion restriction properties in histology proven Gleason 9 prostate carcinoma. These MR findings were reported as a PI-RADS 5.

