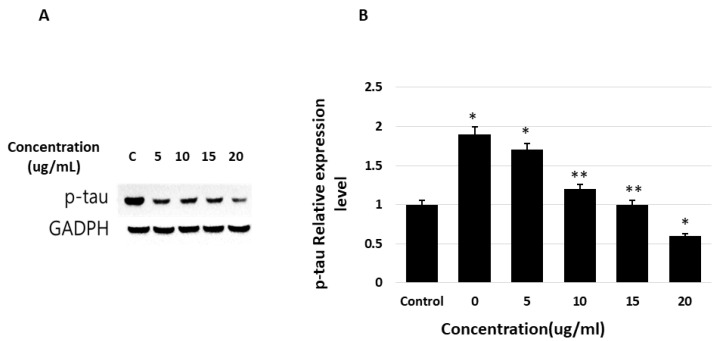
Figure 8.
Effects of theasaponin E1 on tau phosphorylation levels determined by WB. Protein expression as fold change relative to that of the control (actin) after normalization. (A) Western blotting results after treatment of cells and expression of tau, p-tau, and GAPDH on PAGE. (B) Phosphorylated-tau relative protein expression levels determined by western blotting. Data are shown as mean (n = 3) ± SEM (* p < 0.01 and ** p < 0.001 compared to the control).

