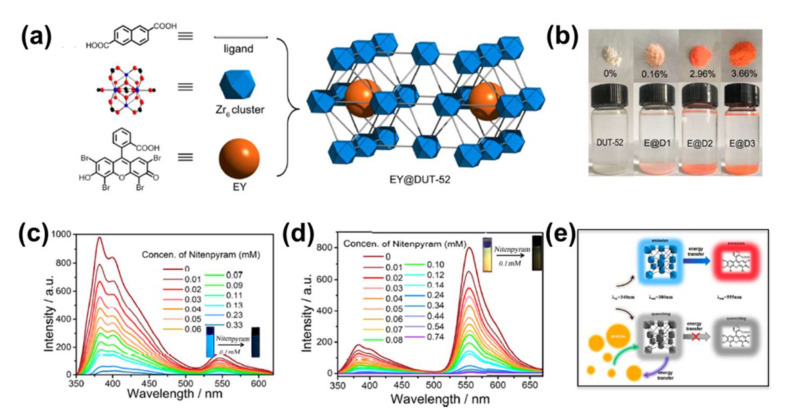
Figure 17.
(a) Structure diagram of the as-prepared EY@DUT-52 sample. (b) Optical pictures of DUT-52 and three EY@DUT-52 samples under sunlight (the solvent in the vial is ethanol). (c) Fluorescent emission spectra of E@D1/ethanol suspensions with different concentrations of nitenpyram. (d) Fluorescent emission spectra of E@D3/ethanol suspensions with different concentrations of nitenpyram. Adapted from [127].

