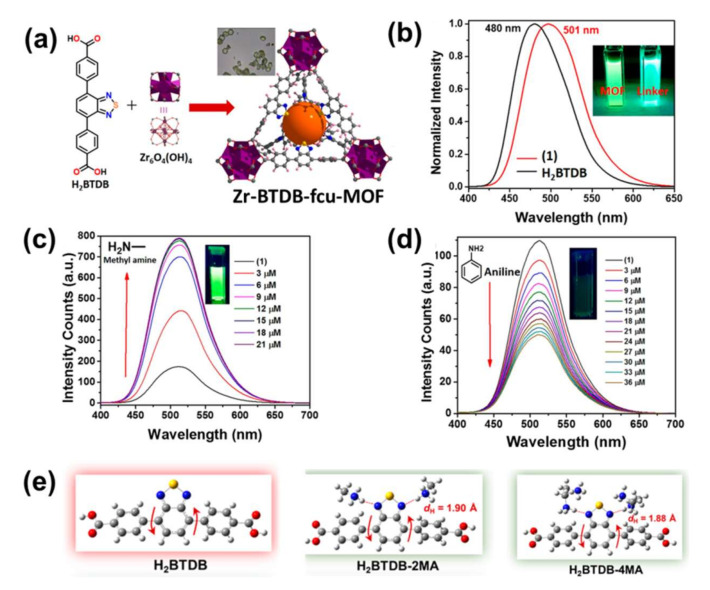
Figure 20.
(a) Schematic representation of the synthesis of Zr-BTDB-fcu-MOF (1). (b) PL spectra for (1) (red) and linker (black). (c) Fluorescence intensity of (1) aqueous suspension upon addition of 3 μM of of MA (c), aniline (d) (λmax = 515 nm). (e) Molecular structures of H2BTDB, H2BTDB with two and four MA molecules. Red arrows represent the dihedral angles between benzene and thiadiazole-based units, and red dashed lines indicate the hydrogen-bond lengths (dH) formed by H of MA and N of thiadiazole Adapted from [146].

