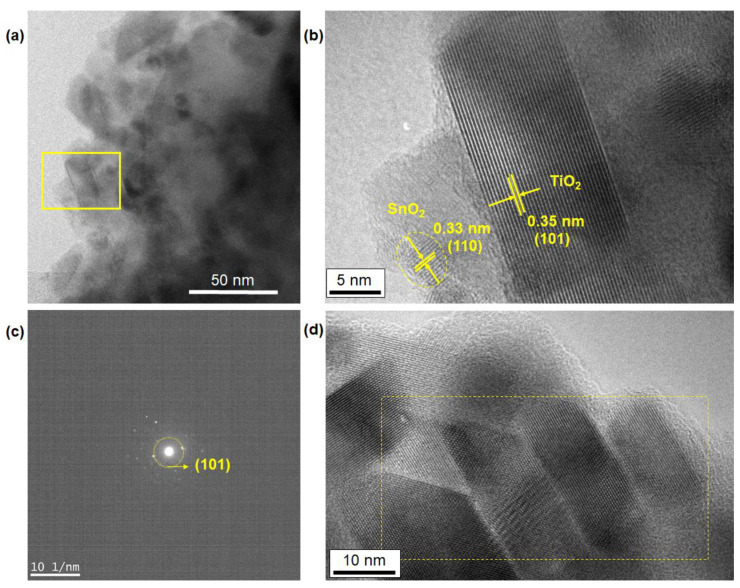
Figure 7.
(a,b) TEM images of the as-deposited film after nanofluid pool boiling. The yellow part shown in (a) corresponds to the position of the high-resolution TEM (HR-TEM) image of (b). (c) The selected-area diffraction pattern indicating the diffraction spots of the 101 plane of the TiO2 particles that correspond to the image (b). (d) HR-TEM image of the sintered sample at 550 °C (ramping rate: 15 °C/min, period of maximum temperature: 1 h). The area shown in a dotted yellow line indicates the joining of some TiO2 nanoparticles as a result of the sintering process. The spacing of each lattice fringe, 0.35 nm, of the TiO2 anatase phase is omitted for clarity.

