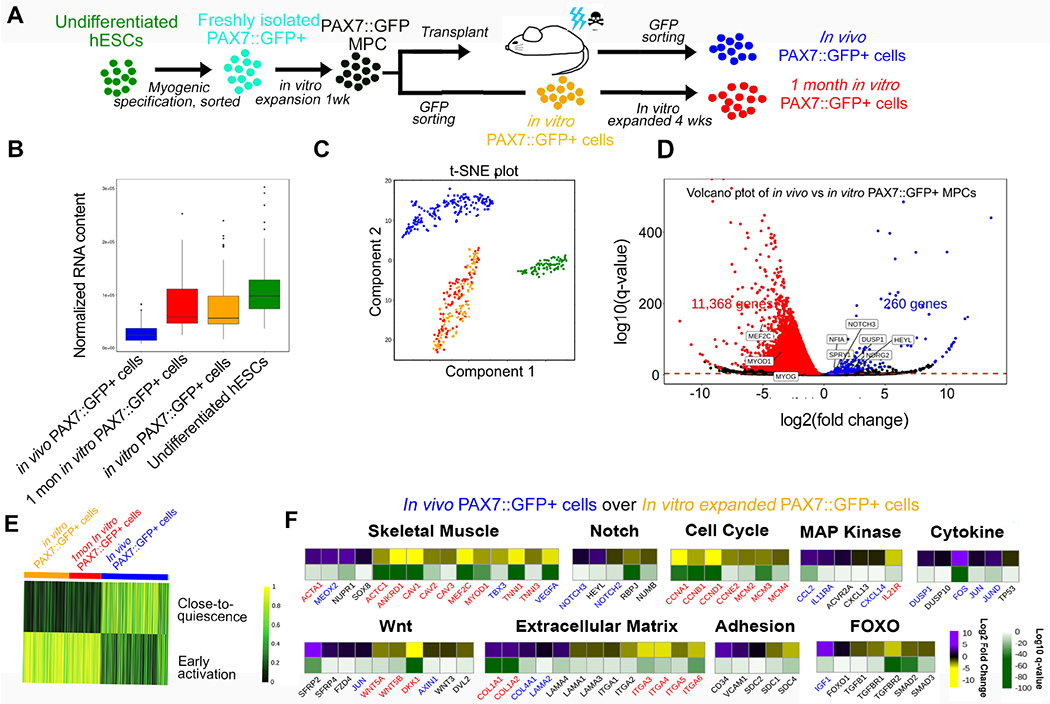
Figure 2. Single-cell RNA sequencing of PAX7::GFP+ cells isolated from TA of NSG mice four weeks after PAX7::GFP MPC transplantation.

(A) Schematic of the origin of cells undergoing single cell RNA sequencing. (B) Normalized RNA content of in vivo PAX7::GFP cells, in vitro PAX7::GFP cells, 1 month in vitro PAX7::GFP+, and hESCs showing in vivo PAX7::GFP+ cells have less RNA content compared with the other three groups. (C) t-SNE plot showing the distinctive RNA expression profiles among undifferentiated hESCs (green), in vitro PAX7::GFP+ cells (yellow), 1 month in vitro PAX7::GFP+ cells (red), and in vivo PAX7::GFP+ cells (blue). (D) Volcano plot of differentially expressed genes in PAX7::GFP+ in vivo cells vs. in vitro PAX7::GFP+ cells. (E) Heat map showing in vivo PAX7::GFP+ cells share molecular signatures of quiescent mouse satellite cells (Dell’Orso et al., 2019). (F) Heat map of differentially expressed genes of in vivo PAX7::GFP+ cells over in vitro PAX7::GFP+ cells. Log2 and log10 values were both presented. Blue highlighted genes were upregulated and red highlighted genes downregulated in human satellite cell studies when comparing quiescent to activated satellite cells (Charville et al., 2015). See also Figure S3 and Table S1.
