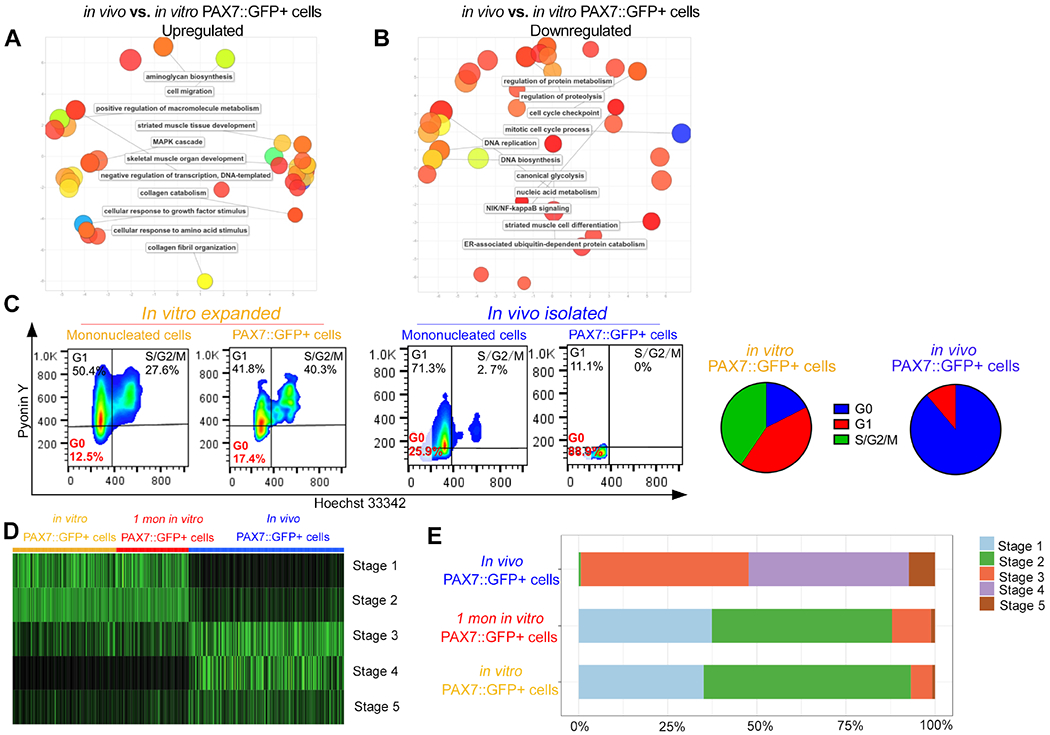
Figure 3. PAX7::GFP+ cells become quiescent and developmentally mature after being exposed to the in vivo environment.

(A-B) Clustering analysis of the Gene Ontology (GO) Biological Process of up- and down-regulated genes in in vivo PAX7::GFP+ cells compared with in vitro PAX7::GFP+ cells. (C) Pyronin Y and Hoechst cell cycle analysis of in vivo PAX7::GFP+ cells and in vitro PAX7::GFP+ cells. (D) Heat map distribution of developmental score across in vitro PAX7::GFP+ cells, 1 month in vitro PAX7::GFP+ cells, and in vivo PAX7::GFP+ cells. (E) Proportions of in vitro PAX7::GFP+ cells, 1 month in vitro PAX7::GFP+ cells, and in vivo PAX7::GFP+ cells assigned to each computational developmental stage. See also Figure S4 and Table S2.
