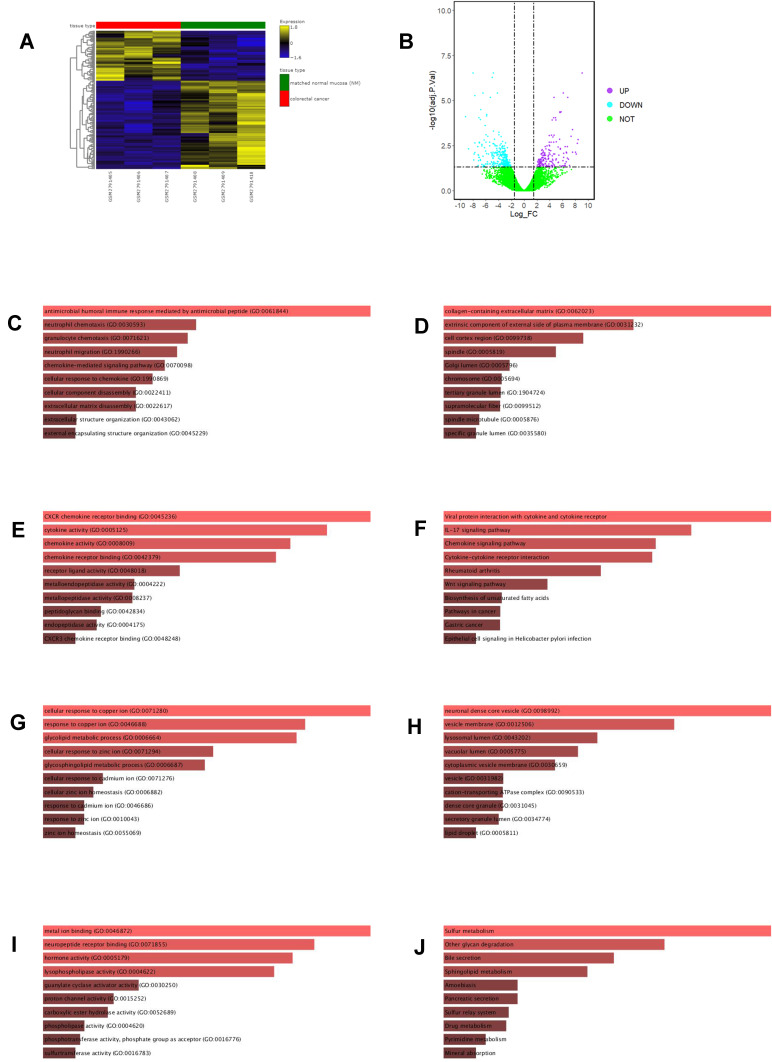
Figure 2.
Analysis of DEGs from GSE104178. (A) Heatmap illustrates the top 200 DEGs in GSE104178 according to FDR p values. (B) Volcano plot illustrates the DEGs in GSE104178. (C) GO_Biological process enrichment of up-regulated DEGs from GSE104178. (D) GO_Cellular component enrichment of up-regulated DEGs from GSE104178. (E) GO_Molecular function enrichment of up-regulated DEGS from GSE104178. (F) KEGG pathway enrichment of up-regulated DEGs from GSE104178. (G) GO_Biological process enrichment of down-regulated DEGs from GSE104178. (H) GO_Cellular omponent enrichment of down-regulated DEGs from GSE104178. (I) GO_Molecular function enrichment of down-regulated DEGS from GSE104178. (J) KEGG pathway enrichment of down-regulated DEGs from GSE104178.

