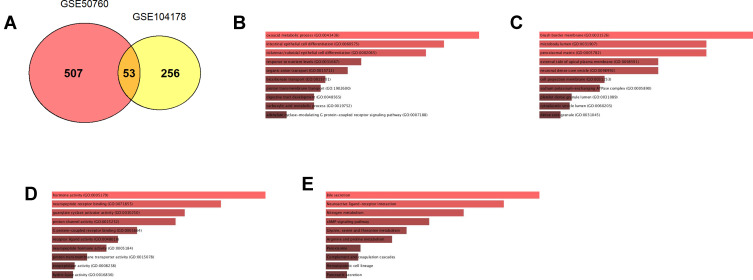
Figure 3.
Functional enrichment of overlapped DEGs between GSE50760 and GSE104178. (A) Venn diagram illustrates the overlapped DEGs between GSE50760 and GSE104178. (B) GO_Biological process enrichment of overlapped DEGs between GSE50760 and GSE104178. (C) GO_Cellular component enrichment of overlapped DEGs between GSE50760 and GSE104178. (D) GO_Molecular function enrichment of overlapped DEGs between GSE50760 and GSE104178. (E) KEGG pathway enrichment of overlapped DEGs between GSE50760 and GSE104178.

