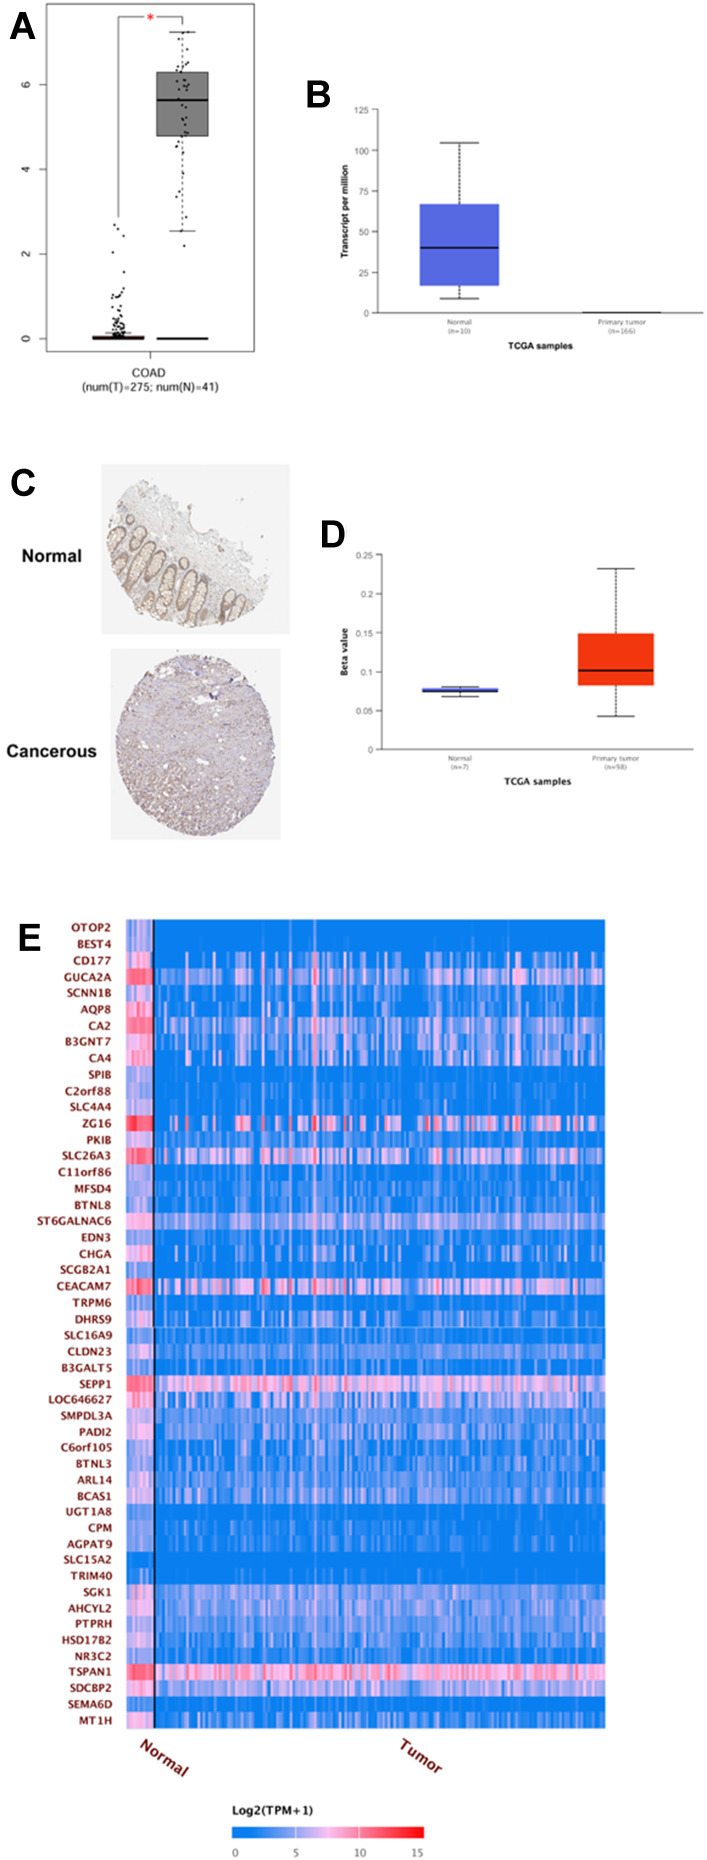
Figure 6.
Expression analysis of OTOP2 in the CRC tissues. (A) The expression level of OTOP2 in the CRC tissues and normal tissues was examined by using GEPIA tool. (B) The expression level of OTOP2 in the CRC tissues and normal tissues was examined by using UACLAN tool. (C) The protein expression of OTOP2 in the CRC tissues and normal tissues was determined by the Human Protein Atlas tool. (D) The promoter methylation of OTOP2 in the CRC tissues and normal tissues was examined by using UACLAN tool. (E) The correlation between OTOP2 and other genes (top 50 genes) was analyzed using UACLAN tool. *P < 0.05.

