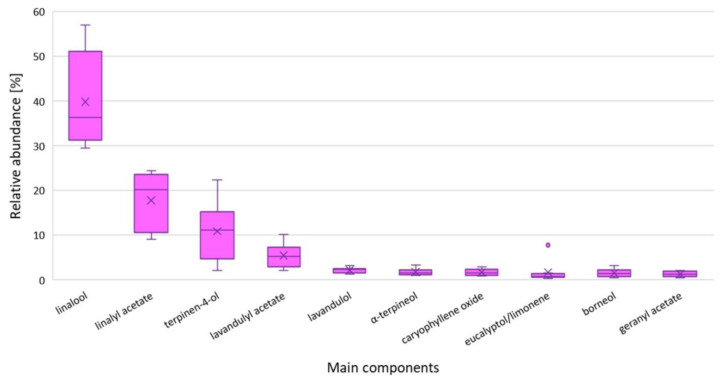
Figure 1.
The relative abundances of the main components in the studied L. angustifolia essential oils. The boxes represent the Q1–Q3 interquartile ranges. Lines intersecting the box represent the medians, and crosses represent the average value. Whiskers represent the lowest and highest results. Dots represent outlying results.

