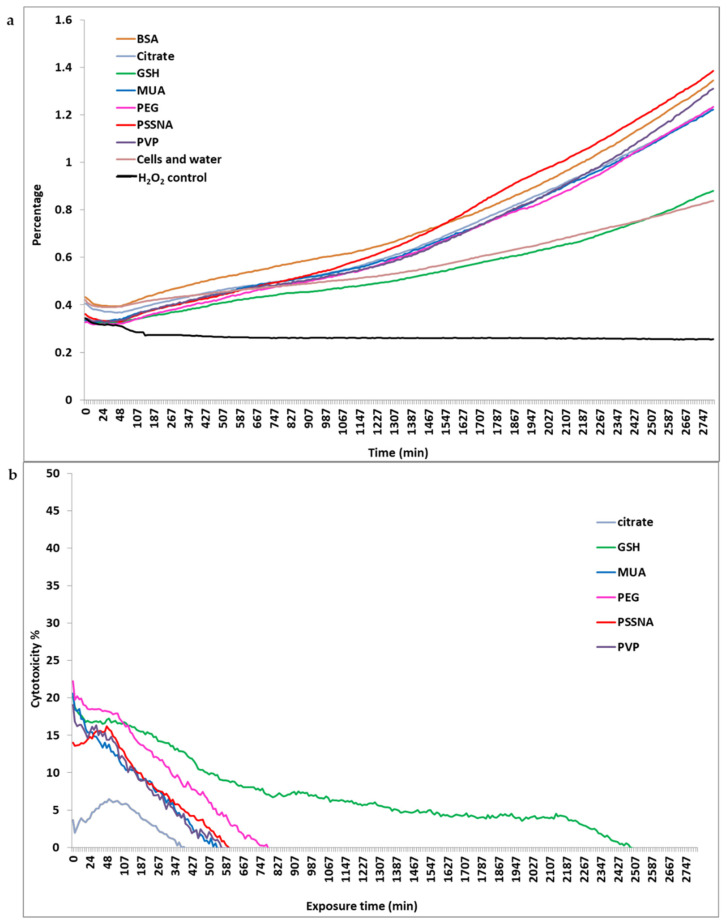
Figure 4.
(a) Growth curve of the HepG2 cells after dosing them with the GNP-ligands using the IC 30 concentration determined by the impedance of the xCELLigence technology. (b) is the inverse graph of (a), where the cytotoxicity of the GNP-ligands has been determined. This data is based on an average of triplicate readings obtained for each concentration.

