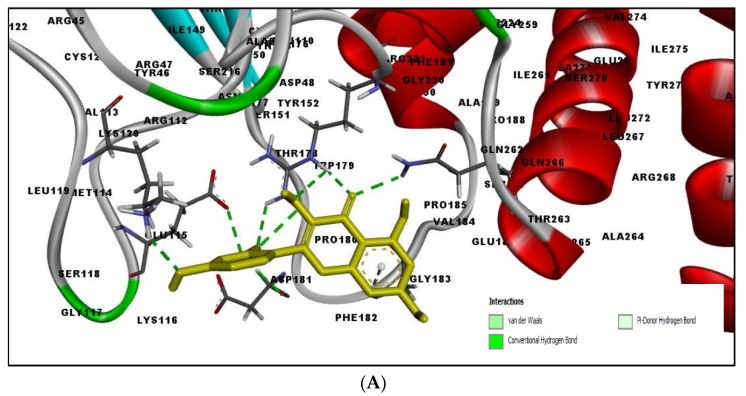
Figure 3.
Three-dimensional view depicting molecular interaction of few top shortlisted polyphenols with the catalytic active site of PTP1B protein. (A) Morin (Glu115, Lys120, Asp181, Gly183, Arg221, Gln266). (B) Cianidanol (Glu115, Arg221, Gln262, Thr263). (C) Baicalein (Glu115, Lys116, Lys120, Cys215, Gly220, Arg221, Gln266). The dashed lines represent the bond formations between ligand and amino acids (protein). Color code representation: dark green—conventional H-bond; light green—van der Waals; pale green—Pi-Donor H-bond; purple—Pi-sigma bonds; dark orange—Pi-anion; light orange—Pi-cation; pink—Pi-alkyl.


