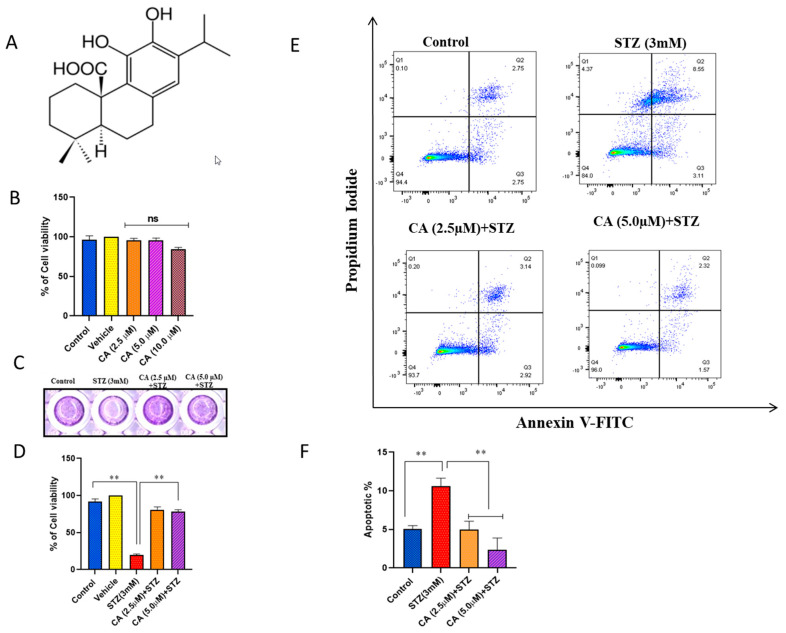
Figure 1.
Impact of CA or STZ treatment on cell viability and apoptosis in INS-1 cells. (A) CA chemical structure. (B) MTT assay in INS-1 cells preincubated with various concentrations of CA (2.5, 5, 10 µM) for 24 h compared to untreated cells. (C) Crystal violet staining for INS-1 cells. (D) MTT assay in STZ-treated cells (3 mM) or preincubated cells with 2.5 or 5 µM of CA for 24 h followed by STZ-treated versus untreated control cells. (E) Annexin V-PI analysis of apoptosis in untreated control cells, STZ-treated cells for 3 h, or cells pretreated with CA for 24 h prior to STZ exposure. Q1, Q2, Q3, and Q4 represent the necrotic, late apoptotic, early apoptotic, and viable cell populations. (F) Apoptotic index summarizes the apoptosis results. Data were obtained from three independent experiments. ** p < 0.01. Bars represent mean ± SD.

