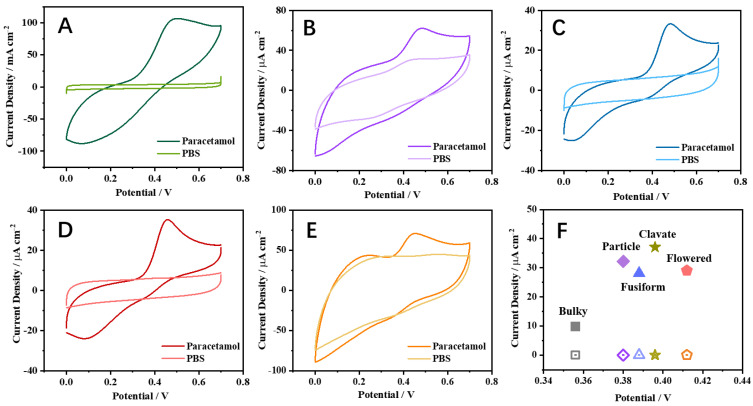
Figure 3.
CV curves at (A) clavate, (B) fusiform, (C) flowered, (D) bulky, and (E) particle BiVO4 in 0.01 M PBS with and without 100 µM paracetamol. Scan rate: 100 mV s−1. (F) The current densities at BiVO4 electrode in 0.01 M PBS without (hollow icon) and with (solid icon) 100 µM paracetamol from the DPV curve. The X−axis is the peak potential at different morphologies of BiVO4 from DPV curves.

