Figure 4.
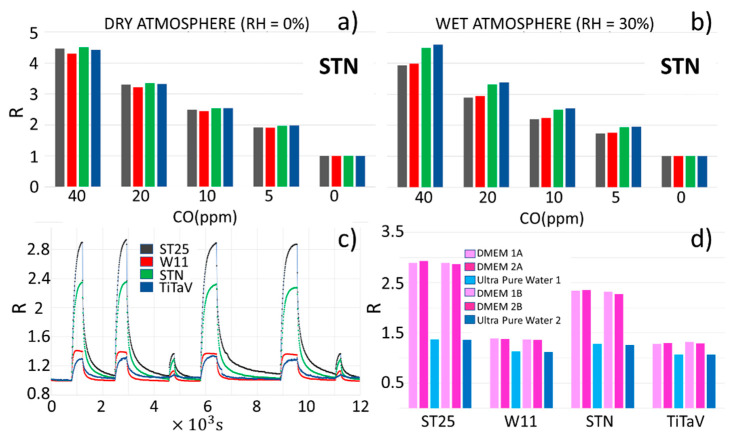
Sensor reproducibility and measure repeatability. (a) Response amplitudes () of four different STN sensors exposed to decreasing CO concentrations (from 40 to 0 ppm) in dry atmosphere. (b) Same as (a), but in 30% relative humidity; (c) plot of vs. time of the sensors equipping the SCENT B1 (ST25, STN, TiTaV, and W11), exposed repetitively to different batches of DMEM and pure water to assess the measures’ repeatability; (d) bar graph of for each sensor to the samples of (c).

