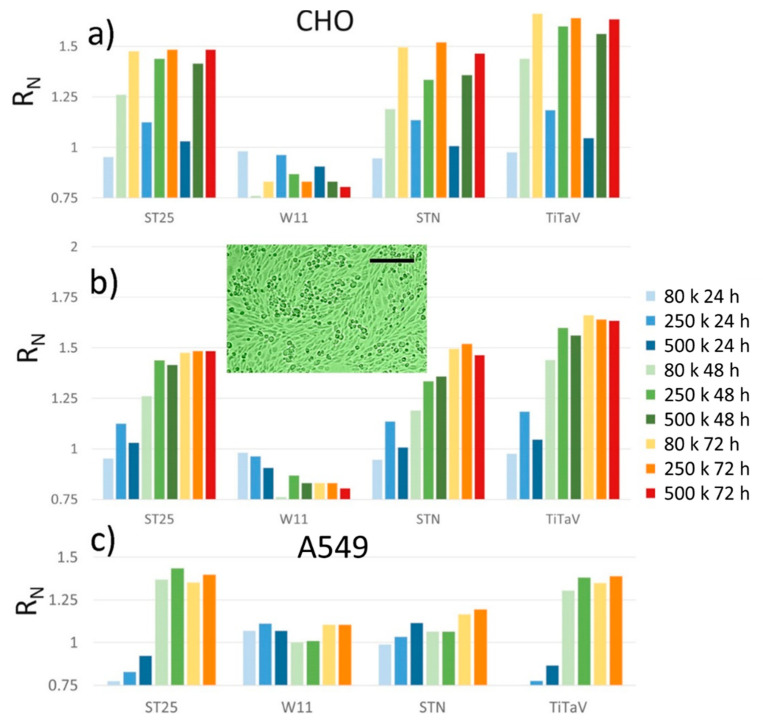
Figure 12.
Sensor responses to CHO and A549 cell lines. Cells plated at 80 K (lightest colors), 250 K (light colors), 500 K (medium dark colors), and 1 M (darkest colors) cells/dish, measured after being withdrawn from the incubator at 24 h (blue), 48 h (green) and 72 h (orange); (a) CHO cells sorted for the same concentration at different times of incubation; (b) CHO cells sorted for the same time of incubation but at different concentrations; the TiTaV response to A549 plated at 80 K cells/dish is not visible because it was smaller than 0.75; (c) A549 cells, same color coding as (b). Insert, microphotograph of CHO cells seeded at 500 K cells/dish after 48 h of plating; scale bar is 200 µm.

