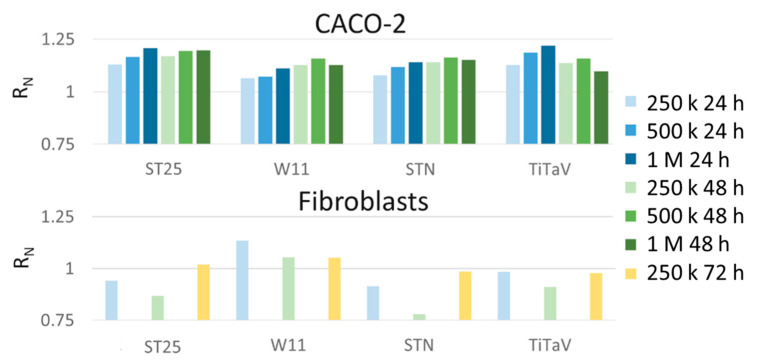
Figure 13.
Sensor responses to CACO-2 and fibroblast cell lines. Cells plated at 250 K (light colors), 500 K (medium dark colors), and 1 M (darkest colors) cells/dish, measured after being withdrawn from the incubator at 24 h (blue), 48 h (green) and 72 h (orange); cells sorted for the same concentration at different times of incubation. The sensor responses not visible in the histograms were smaller than 0.75.

