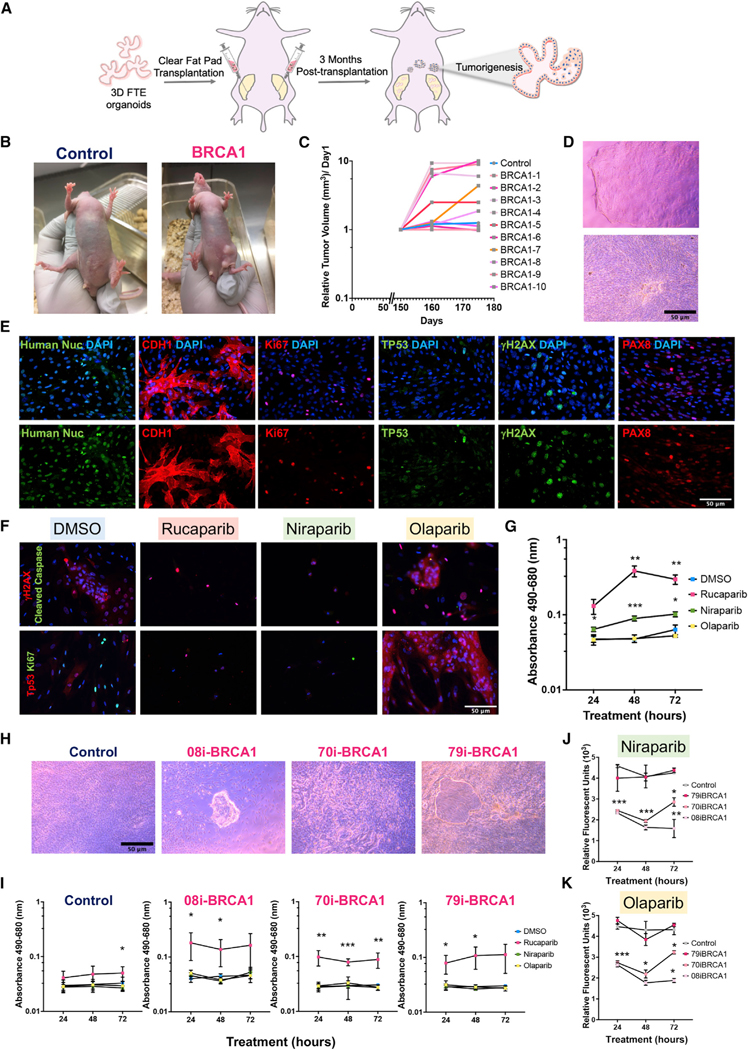
Figure 6. BRCA1mut-iPSC-derived FTE organoids show malignant characteristics of the BRCA1mut lesions in vivo.
(A) Schematic of organoid transplantation into mouse fat pads.
(B) Mice at 5 months post-transplantation of control-FTE organoids (87i-CTR line) and BRCA1mut-FTE organoids (79i-BRCA line).
(C) Control and BRCA1mut line tumor growth rates.
(D) Brightfield images of primary cells from BRCA1mut tumor lesions.
(E) Immunocytochemistry of primary cells from BRCA1mut tumor lesions shows cancer markers CDH1, PAX8, TP53, and Ki67; double-stranded DNA break marker γH2AX; and DAPI nuclei stain.
(F) Immunocytochemistry for TP53, Ki67, γH2AX, and cleaved Caspase 3 in primary cells from BRCA1mut tumor lesions treated for 72 h with 100 μM rucaparib, niraparib, olaparib, or DMSO, with DAPI nuclei stain.
(G) Cellular cytotoxicity assay (LDH assay) of primary cells from BRCA1mut tumor lesions over 72 h in response to 100 μM rucaparib, niraparib, or olaparib or DMSO.
(H) Brightfield images of primary cells from 8-months-old control and BRCA1mut-FTE organoids (87i-CTR, 08i-BRCA, 70i-BRCA, and 79i-BRCA).
(I–K) (I) Time course of LDH assay in response to 100 μM rucaparib treatment of primary cells from 8-monthsold control and BRCA1mut-FTE organoids (87i-CTR, 08i-BRCA, 70i-BRCA, and 79i-BRCA). PrestoBlue cell viability assay for primary cells from 8-monthold control and BRCA1mut-FTE organoids in response to 100 μM. (J) niraparib and (K) olaparib. Scale bars, 50 μm. Significance was calculated using 2-way ANOVA, Dunnett multiple comparisons;*p < 0.05, **p < 0.01, ***p < 0.001. Error bars are SD (n = 3 independent biological experiments).

