. 2022 Apr 11;11:e73225. doi: 10.7554/eLife.73225

Figure 1. Mapping the promoter-binding preferences of whole-genome duplication (WGD) transcription factors (TFs).

(A–B) WGD shaped the budding yeast transcription network: (A) TF duplicates (paralogs) can diverge to bind different targets. (B) In Saccharomyces cerevisiae, ~35% (Gietz et al., 1995) of all present-day TFs are retained WGD paralogs, belonging to 18 different DNA-binding domain families (see Figure 1—figure supplement 1). (C) TF-binding profiles are reproducible: Shown is the distribution of correlations between different samples (gray) and between biological repeats (purple). Correlations are between promoter-binding signals (pbs). (D) Binding profiles of indicated TF-paralog pairs. Top: Measured binding signal and nucleosome occupancy (Nuc.) on individual promoters (see Materials and methods). Lines indicate transcription start sites (TSS, red dashed) and locations of in vitro motifs (blue). Bottom: Pbs of the indicated TF-paralog pairs (each dot is a promoter, r: Pearson’s correlation). (E) Auto- and cross-promoter binding by TF paralogs: Pbs is shown as z-score. Potentially formed circuits indicated on top. Note that 22/30 pairs are associated with six of nine possible circuits.

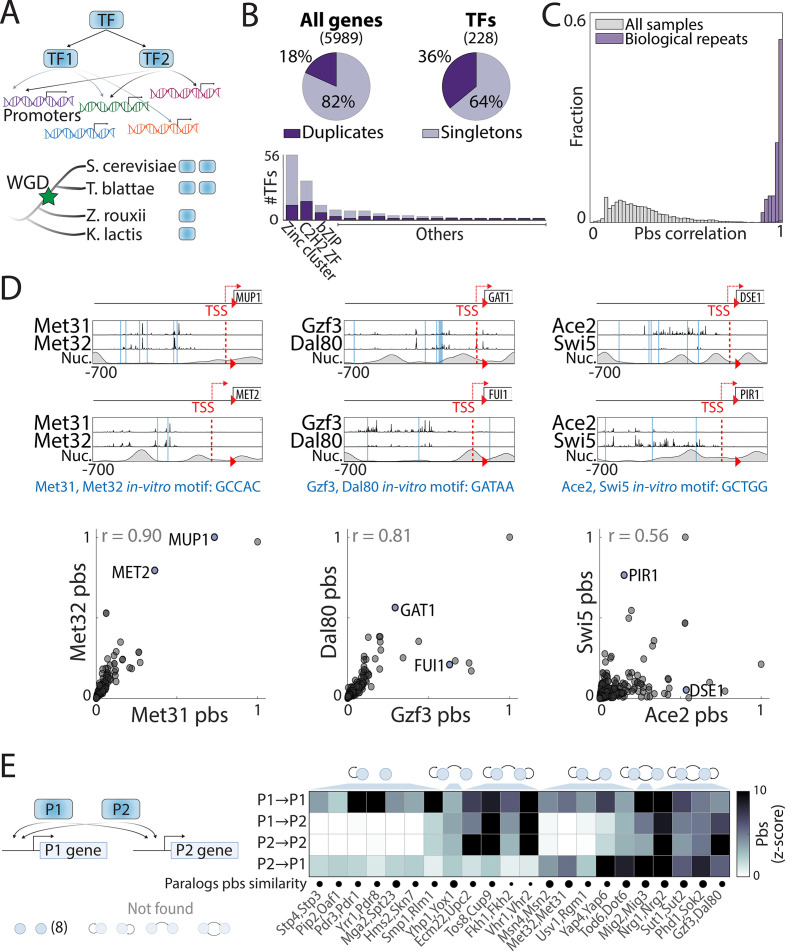
Figure 1—source data 1. Details for statistical analysis (correlations).

Figure 1.

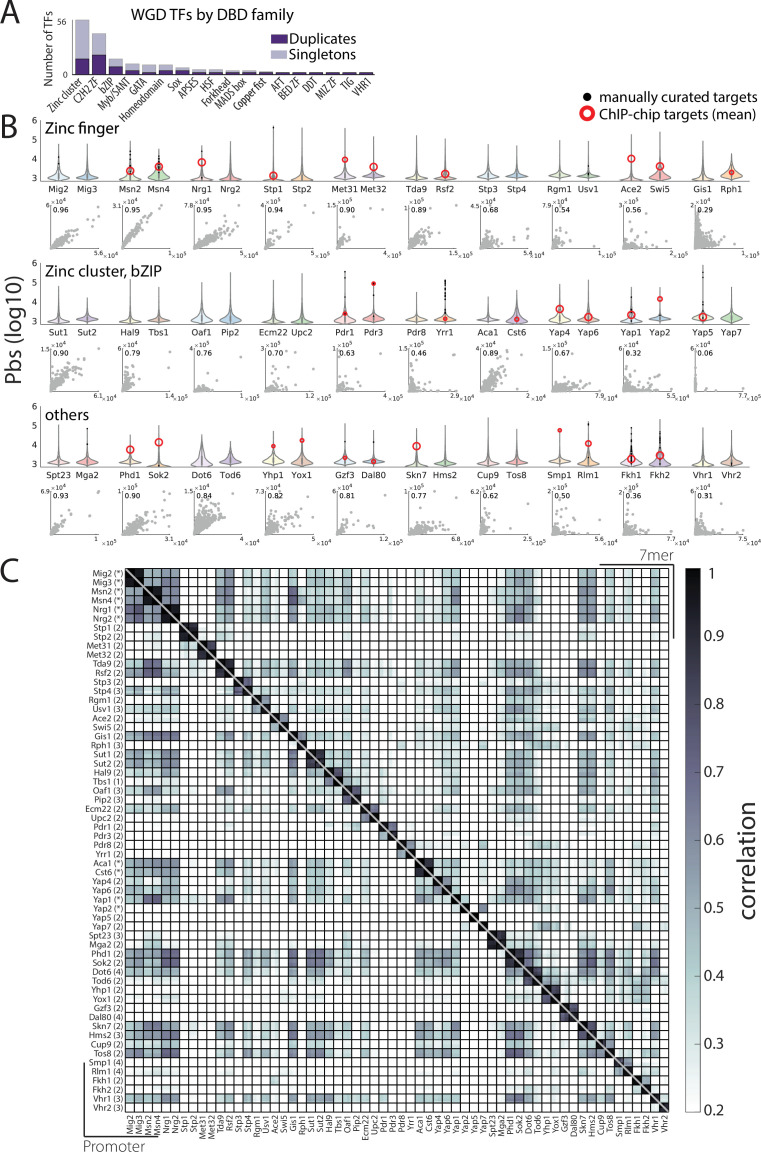
Figure 1—figure supplement 1. Sensitive, accurate, and reproducible mapping of whole-genome duplication (WGD) transcription factors (TFs) DNA-binding profiles with chromatin endogenous cleavage with high-throughput sequencing (ChEC-seq).

Figure 1—figure supplement 1.

(A) WGD TFs by DNA-binding domain (DBD) family: Shown are the number of TFs in each family divided into WGD duplicates and singletons. (B) TFs promoter-binding signal (pbs) using ChEC-seq identifies known and new target promoters: Pbs distribution for all WGD-generated TF paralogs (top violin plot, log-scale) and direct paralog-paralog comparison (x-axis first paralog). Manually curated and chromatin immunoprecipitation with DNA microarray (ChIP-chip) targets from Saccharomyces cerevisiae genome database (SGD) (Cherry et al., 2012) are highlighted and intra-pair Pearson’s r indicated (scatter plot, left-top corner). (C) Distinct and reproducible binding profiles for 60 mapped TFs: Binding signal correlation (bottom triangle: promoters, top triangle: 7-mers, Pearson’s r) between all repeats for all profiled TFs (each row/column corresponds to an individual biological repeat, number of repeats indicated in parenthesis, * indicates profiles obtained from Brodsky et al., 2020).