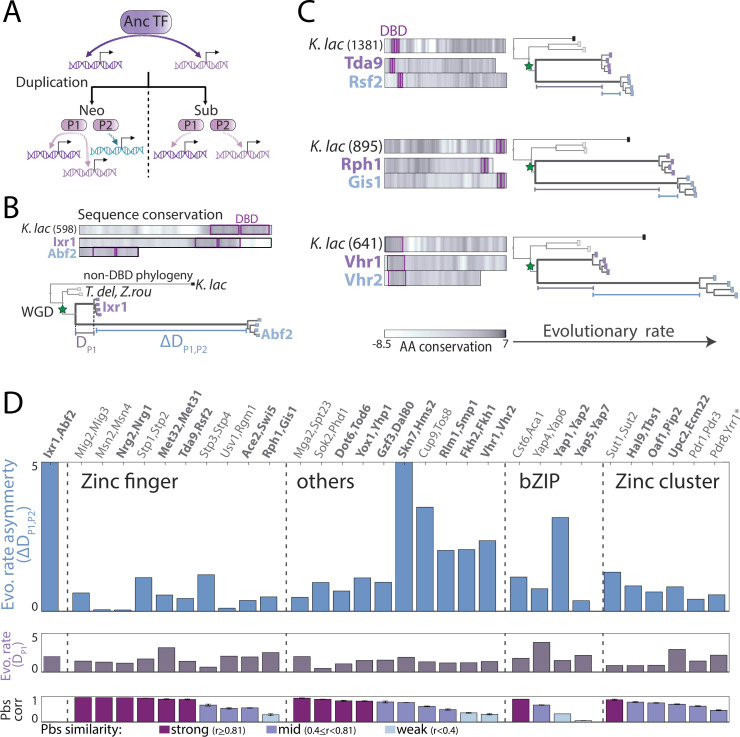
Figure 6. Asymmetric sequence evolution in whole-genome duplication (WGD) transcription factor (TF) paralog pairs.
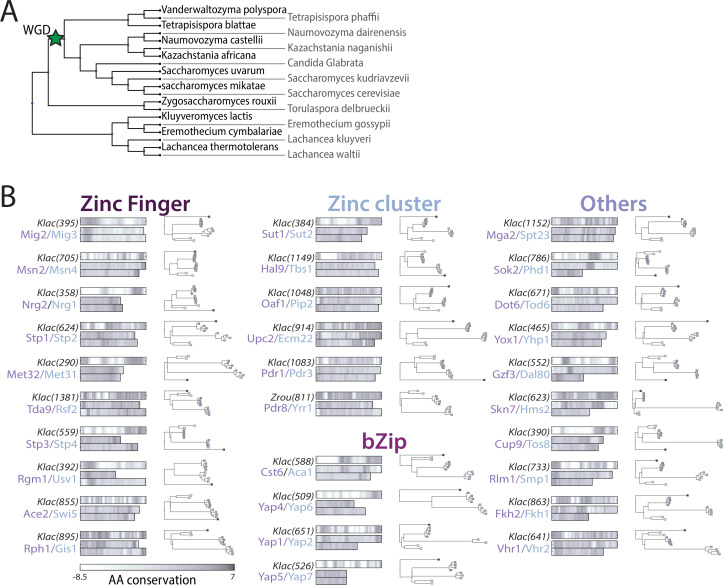
(A) Models of functional divergence after WGD: Paralogs could diverge by one-sided acquisition of new preferences (neo-functionalization) or by splitting ancestral preferences (sub-functionalization). (B–C) Sequence evolution of indicated paralog pairs. (B) Sequence variations among Ixr1/Abf2, a strongly diverged paralog pair. Top: Sequence conservation between the Kluyveromyces lactis ortholog and the non-WGD consensus sequence, or each Saccharomyces cerevisiae paralogs and the K. lactis ortholog along the respective protein length. Conservation score is the smoothened amino acid (AA) substitution score of the respective residue in a pairwise sequence alignment (see Materials and methods). Bottom: Phylogenetic comparison of non-DNA-binding domain sequences, indicating distance from the last common ancestor (LCA) to the conserved paralog (purple line, DP1), and the distance difference between the paralogs, that is, evolutionary rate asymmetry (blue line, ∆DP1,P2, see Materials and methods for details). (C) As in (B) for the indicated paralog pairs with different levels of evolutionary rate asymmetry (see Figure 6—figure supplement 1 for all pairs). (D) Evolutionary rate asymmetry (∆DP1,P2), evolutionary rate of the conserved paralog (DP1), and correlation in promoter-binding signals (pbs) for all paralog pairs. Paralogs chosen for further experimental analysis are highlighted in bold (*: lacking K. lactis ortholog).


