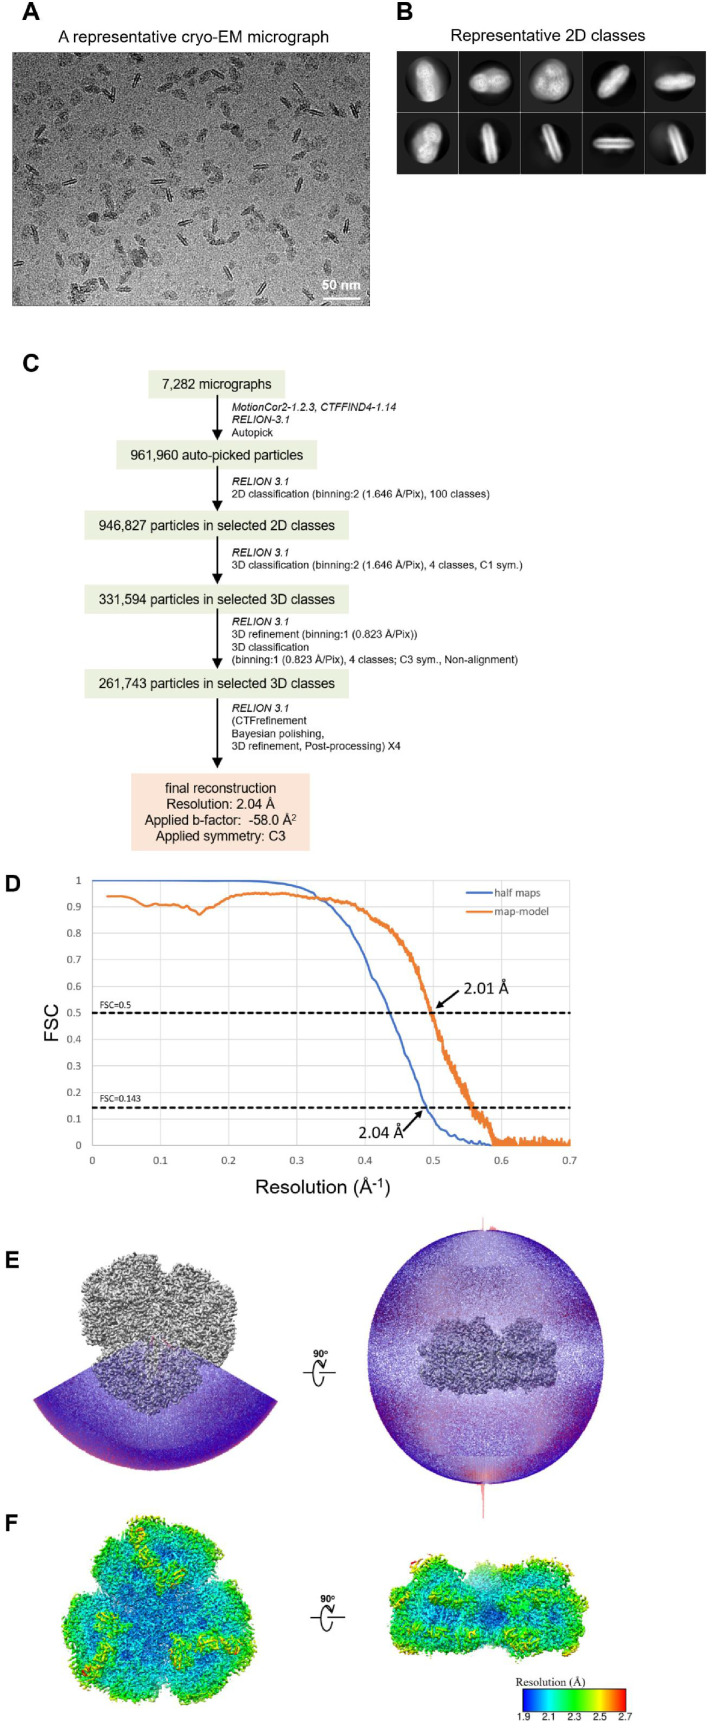
Appendix 1—figure 2. Cryo-EM data collection and processing of the Gloeobacter PSI trimer.
(A) Representative cryo-EM micrograph of the PSI trimer. (B) Representative 2D classes of the PSI trimer. The box size is 330 Å. (C) A flowchart showing the classification scheme of the PSI trimer. The overall structure of PSI was reconstructed at a 2.04-Å resolution from 261,743 particles. (D) FSC curves of the PSI trimer for independently refined half maps (half maps) and full map vs. model (map-model). (E) Angular distribution of the particles used for reconstruction of the PSI trimer. Each cylinder represents one view, and its height is proportional to the number of particles. (F) Local resolution map of the PSI trimer.

