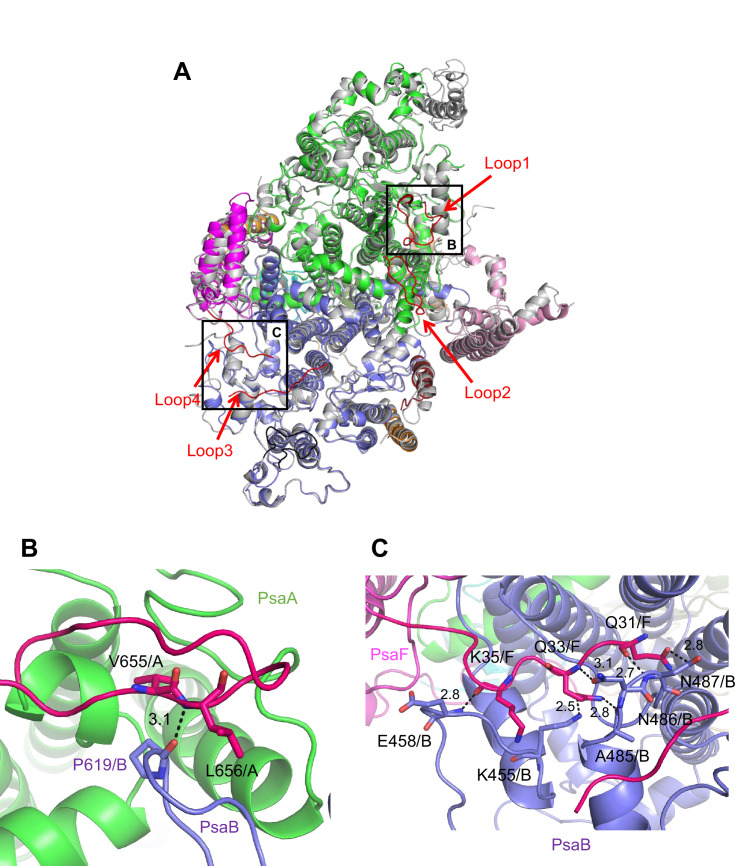
Figure 3. Characteristic structure of the Gloeobacter photosystem I (PSI).
(A) Superposition of the structure of Gloeobacter PSI (colored) with that of the Synechocystis PSI (gray) (PDB: 5OY0) viewed along the membrane normal from the periplasmic side. Structural differences of loop insertions are colored in red. The RMSD is 0.82 Å for 2,019 Cα atoms from subunits observed commonly between Gloeobacter and Synechocystis PSIs. (B, C) Closeup views of the loop insertions in the regions of Asn652–Ser665 of PsaA (Loop2) in the Gloeobacter PSI (B) and of Gln31–Asp36 of PsaF (Loop4) in the Gloeobacter PSI (C).

