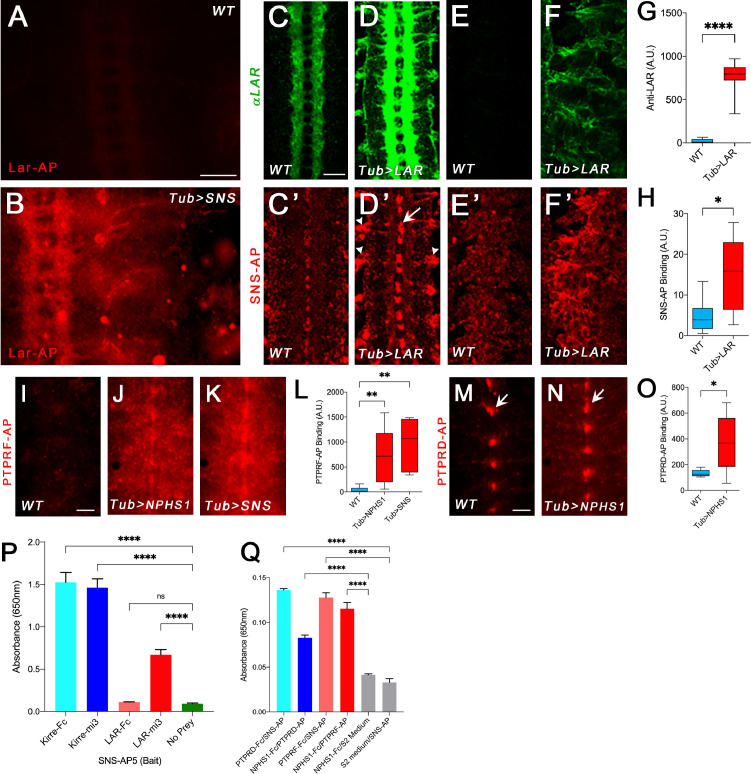
Figure 1. Binding of Lar and its orthologs to Sns and Nephrin.
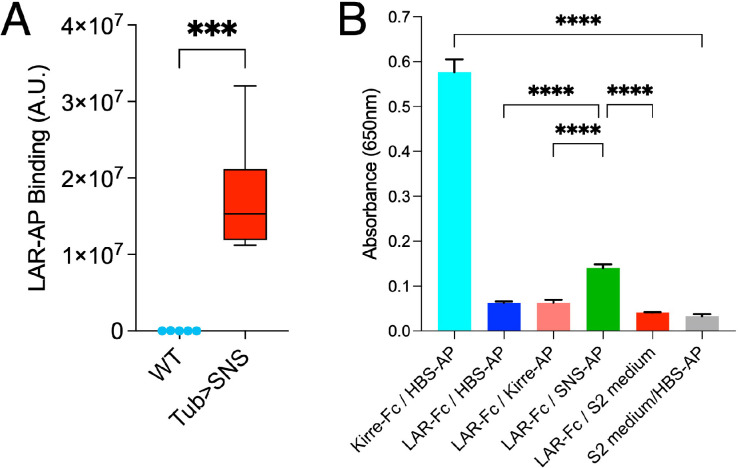
All images show live-dissected late-stage 16 embryos. (A, B) Staining with a version of Lar-AP (HS2) that cannot bind to heparan sulfate proteoglycans (HSPGs), visualized with anti-AP antibody. (A) WT embryo; Lar-AP binds weakly to central nervous system (CNS) axons (see Fox and Zinn, 2005). (B) Tub>Sns embryo at the same exposure, showing bright ectopic staining by HS2-AP in the CNS and periphery. (C–F) Lar overexpression in Tub>Lar embryos, visualized with anti-Lar mAb. (C, D) CNS axon staining in WT (C) and Tub>Lar (D). Longitudinal axons are stained in WT; all axons are brightly stained in Tub>Lar. (E, F) Staining in the periphery in WT (E) and Tub>Lar (F). There is no visible staining in WT, while Tub>Lar embryos show widespread staining. (G) Quantitation of CNS staining with anti-Lar in WT and Tub>Lar. (C’–F’) Staining with Sns-AP5 visualized with anti-AP antibody. (C’, D’) CNS staining in WT (C’) and Tub>Lar (D’). Midline glia are weakly stained in WT (C’); note that this pattern does not resemble anti-Lar staining (C). Midline glia (arrow) and exit junctions (arrowheads) are brightly stained in Tub>Lar (D’); note the similarity between the exit junction patterns visualized with anti-Lar (D) and Sns-AP. (E’, F’) Staining in the periphery in WT (E’) and Tub>Lar (F’). Staining in the periphery is increased in intensity in Tub>Lar. (H) Quantitation of CNS staining with Sns-AP in WT and Tub>Lar. (I–K) CNS staining with PTPRF-AP5 in WT (I), Tub>NPHS1 (J), and Tub>Sns (K) embryos. Note that there is very little staining in WT, but bright staining in the entire CNS in Tub>NPHS1 and Tub>Sns. (L) Quantitation of CNS staining in WT, Tub>NPHS1, and Tub>Sns. (M, N) CNS staining with PTPRD-AP5 in WT (M) and Tub>NPHS1 (N). Note midline glial staining in WT; this staining is only slightly increased in intensity in Tub>NPHS1 (arrows). Staining intensity in the remainder of the CNS is increased by several fold, however. (O) Quantitation of CNS staining in WT and Tub>NPHS1. (P, Q) In vitro binding measured with the ECIA assay using either AP or HRP enzymatic activity for detection. (P) 60-mer Lar prey (Lar-mi3) binds to Sns-AP5 bait. Kirre-Fc and Kirre-mi3 preys bind to Sns-AP5 equally. (Q) Both PTPRD-AP5 and PTPRF-AP5 preys bind to Nephrin-Fc (NPHS1-Fc) bait. PTPRD-AP5 and PTPRF-AP5 also bind to Sns-Fc bait. There is no signal with Nephrin-Fc bait and S2 medium prey or Sns-AP5 prey and S2 medium bait. Scale bar, 20 µm.


