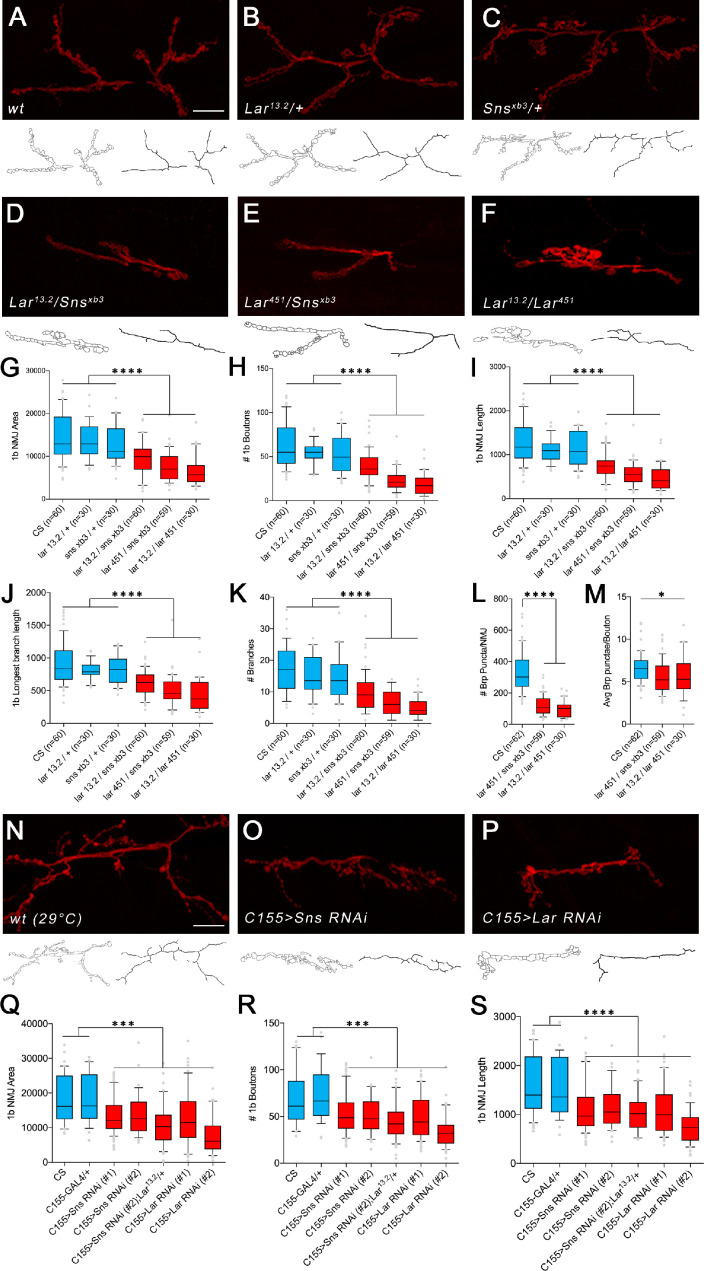
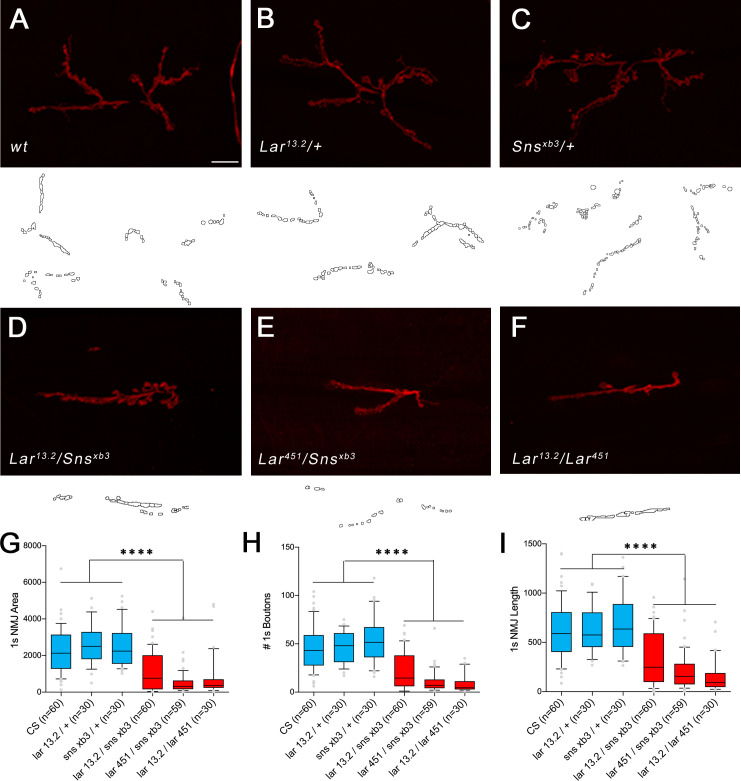
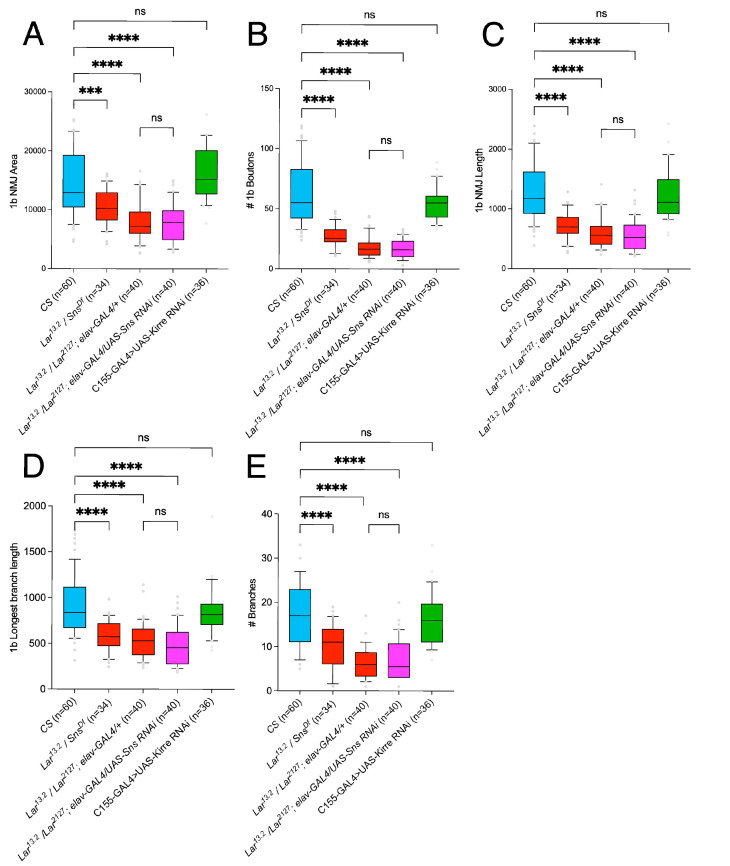
Figure 3. Lar/sns transheterozygotes have the same phenotypes as Lar mutants and Sns knockdowns.
Neuromuscular junctions (NMJs) were analyzed using a published Fiji macro (Nijhof et al., 2016) that uses HRP to outline boutons and measures NMJ area, perimeter, length, longest branch length, number of branches, number of boutons, and Bruchpilot (Brp) labeled punctae. (A–F) Representative images of the NMJ on muscles 7/6 from WT and heterozygote controls (A–C), Lar/sns transheterozygotes (D, E), and Lar mutants (F). NMJs are labeled with anti-HRP (red). NMJ outlines showing boutons and branch architecture as outputs from the macro are under each NMJ image. (G–K) Quantification of 1b NMJ parameters, showing reduced NMJ size and arborization in Lar/sns transhets and Lar mutants (red) compared to het controls (blue). Data is average from segments A2–A4 from minimum 30 NMJs per genotype. (L, M) Quantification of Brp punctae showing reduced number of active zones in Lar/sns transhets and Lar mutants. (N–P) Representative images of NMJs on muscles 7/6 from animals with RNAi-mediated neuronal knockdown of Lar and Sns. Neuronal Lar or sns RNAi results in the same NMJ abnormalities seen in genetic Lar/sns transhets and Lar mutants. (Q–S) Quantification of NMJ parameters showing reduced 1b NMJ area, number of boutons, and NMJ length upon either Lar or Sns knockdown. A2–A4 segments were analyzed from at least 30 NMJs on muscles 7/6. All datasets were analyzed using one-way ANOVA followed by Tukey’s post-hoc correction. ****p<0.0001; ***p<0.001. Scale bar, 20 µm. See Figure 3—figure supplement 1 for analysis of 1s NMJs.


