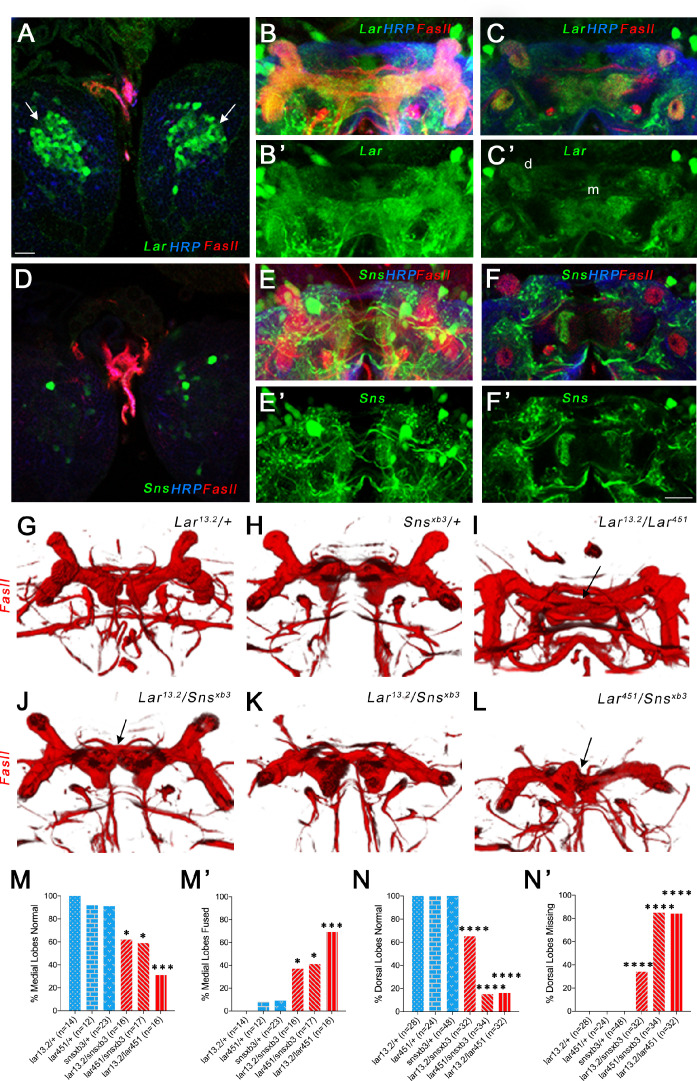
Figure 4. Lar and Sns act in different neurons to control mushroom body (MB) dorsal and medial lobe development.
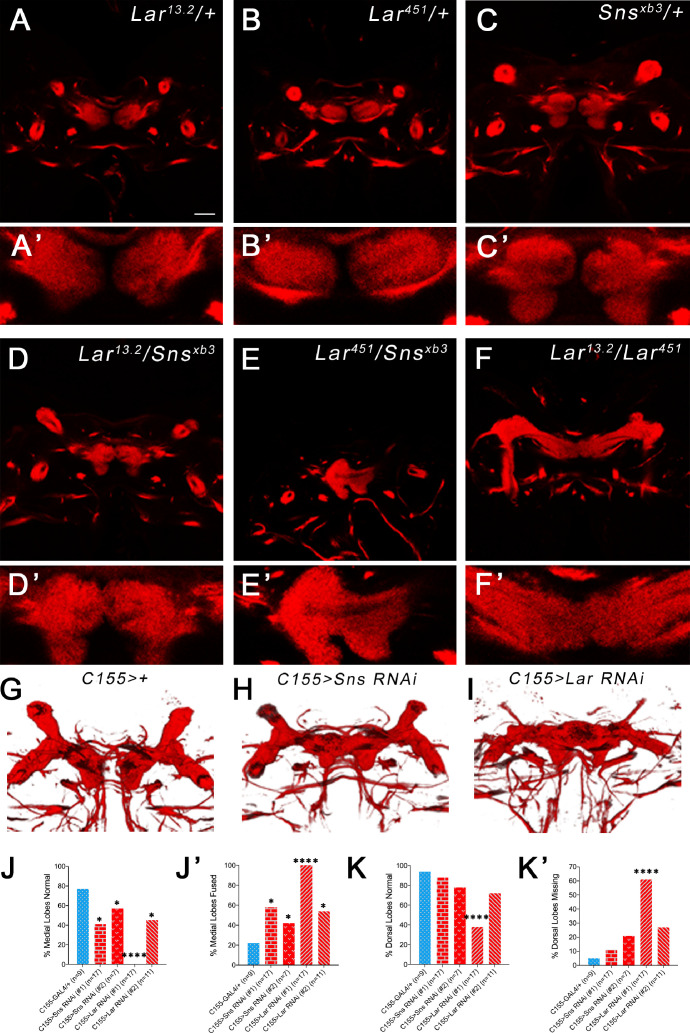
(A–F’) Lar>GFP and Sns>GFP expression in the larval brain. Brains were triple-stained for Lar>GFP (green), FasII (red), and anti-HRP (blue). Anti-FasII labels the MB neuropil; anti-HRP labels neuronal membranes. (A) Lar>GFP expression in Kenyon cells (KCs) (green, arrows). (B, B’) Projection of confocal slices through the entire larval MB showing Lar expression in the MB neuropil. (C, C’) Single optical slice showing Lar expression in the medial (m) and dorsal (d) lobes of the MB. (D) There is no Sns>GFP expression in KCs. (E, E’) Projection of confocal slices through the entire MB showing no overlap between Sns>GFP and the MB neuropil labeled by FasII. (F, F’) Single optical slice through the MB showing no Sns>GFP expression in the MB neuropil. (G–L) Third-instar larval MBs visualized with FasII staining. 3D reconstructions of confocal stacks using Imaris software are shown. (G) and (H) have normal MBs. (I) has missing dorsal lobes and medial lobe fusion (arrow). (J) has a medial lobe fusion phenotype (arrow). (K) has missing dorsal lobes. (L) has missing dorsal lobes and medial lobe fusion (arrow). (M–N’) Quantification of MB phenotypes in heterozygote controls (blue), Lar mutants (red), and Lar/sns transhets (red). In (M) and (N), the percentages of normal MBs are shown; in (M’) and (N’), the percentages of MBs with the phenotype are shown. (M, M’) Medial lobe fusion phenotype, (N, N’) Dorsal lobe branching defect. Data were analyzed using Fisher’s exact test, and each genotype was compared to every other genotype. ****p<0.0001; ***p<0.001; *p<0.05. Scale bar, 20 µm. See Figure 4—figure supplement 1 for single-slice analysis in Lar/sns transhets and Lar and Sns RNAi-mediated MB phenotypes.


