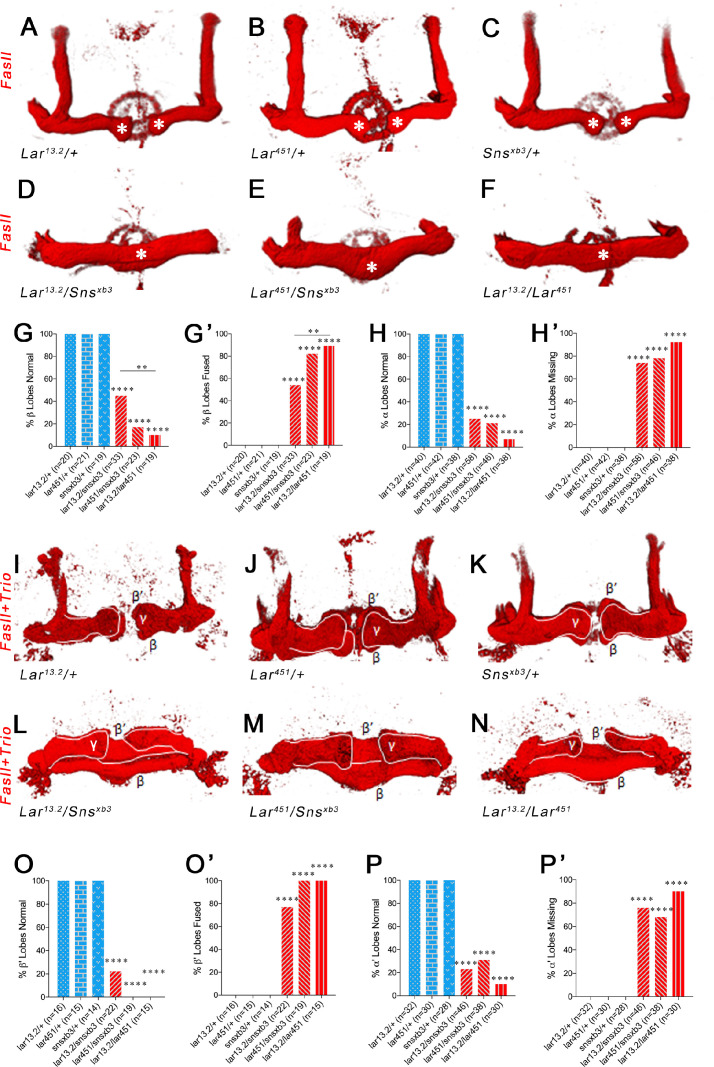
Figure 6. Lar and Sns are required for normal lobe development in the adult mushroom body (MB).
(A–F) 3D reconstructions of confocal stacks from anti-FasII-stained adult brains using Imaris software. (A–C) Heterozygote controls showing normal α and β lobes of the adult MB. Asterisks show the ends of normal β lobes, which stop short of the midline and remain separated. (D–F) Lar/sns transheterozygotes and Lar mutants, showing abnormal MB architecture, with missing α lobes and β lobes fused across the midline. (G, G’) Quantification of β lobe midline fusion phenotype. Heterozygote controls (blue) show completely normal unfused β lobes. Lar/sns transheterozygotes and Lar mutants (red) have fused β lobes. (H, H’) Quantification of α lobe branching defect. Heterozygote controls (blue) have intact α lobes, while Lar/sns transhets and Lar mutants (red) have missing α lobes. In (G) and (H), the percentages of normal MBs are shown; in (G’) and (H’), the percentages of MBs with the phenotype are shown. (I–N) 3D reconstructions of confocal stacks from adult brains stained with FasII and Trio antibody to visualize the entire MB with all lobes. (I–K) Heterozygote controls show normal MB lobes. (L–N) Lar/sns transheterozygotes and Lar mutants show abnormal MB architecture, with fused β and β′ lobes and missing α and α′ lobes. (O, O’) Quantification of β′ lobe midline fusion phenotype showing normal β′ lobes in heterozygote controls (blue) and almost completely fused β′ lobes in Lar/sns transheterozygotes and Lar mutants (red). (P, P’) Quantification of α′ lobe branching defect. Heterozygote controls (blue) have completely normal α′ lobes while Lar/sns transhets and Lar mutants (red) are missing most α′ lobes. In (O) and (P), the percentages of normal MBs are shown; in (O’) and (P’), the percentages of MBs with the phenotype are shown. Data were analyzed using Fisher’s exact test, and each genotype was compared to every other genotype. ****p<0.0001; **p<0.01.


