Abstract
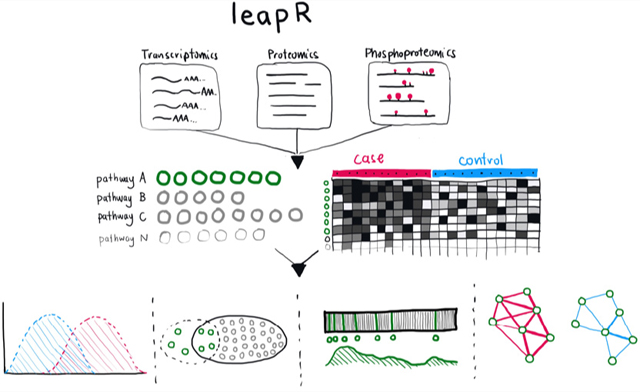
A generalized goal of many high-throughput data studies is to identify functional mechanisms that underlie observed biological phenomena, whether they be disease outcomes or metabolic output. Increasingly, studies that rely on multiple sources of high-throughput data (genomic, transcriptomic, proteomic, metabolomic) are faced with a challenge of summarizing the data to generate testable hypotheses. However, this requires a time-consuming process to evaluate numerous statistical methods across numerous data sources. Here, we introduce the leapR package, a framework to rapidly assess biological pathway activity using diverse statistical tests and data sources, allowing facile integration of multisource data. The leapR package with a user manual and example workflow is available for download from GitHub (https://github.com/biodataganache/leapR).
Keywords: proteomics, phosphoproteomics, pathway analysis, data integration
Graphical Abstract

INTRODUCTION
A generalized goal of high-throughput data studies is to identify functional mechanisms that underlie observed biological phenomena, whether they be disease outcomes or metabolic output. Increasingly, studies that rely on multiple sources of high-throughput data (genomic, transcriptomic, proteomic, metabolomic) are faced with a challenge of utilizing the data in a way that maximizes interpretability. This generally requires a diverse suite of methods and external data packages that to date do not exist in a coherent computational framework. Here, we introduce such a framework that is able to assess biological pathway activity related to phenotypic outcome using multisource data.
Most analysis tools employ statistical tests that compare the genes emerging from a high-throughput screen to known lists of pathways. This functional enrichment approach is a common method to connect the molecular response observed to higher-level biological functions and mechanisms. It is robust to noise and able to detect more subtle signals, because it relies on patterns of many pathway components rather than individual measurements alone. However, there are diverse approaches to pathway enrichment analysis1,2 each used for different purposes and requiring different assumptions about the data. For example, MGSEA adapts the popular GSEA algorithm1 to handle multiomic data inputs using gene rankings3 and is similar to our approach in leapR. PathwayPCA uses a principal component analysis approach to data integration to map multiomics data to pathways.4 ActivePathways uses a multistage approach to identify pathway enrichment from p-values derived from multiple omics types.5 Finally, there are several more sophisticated methods for analysis of pathways for inference of causal relationships from multiomics data, for example, CausalPath, which integrates proteomics and phosphoproteomics data in causal pathway models (http://causalpath.org). WebGestalt, which provides an R package to run locally, provides several different methods for enrichment, but integration of multiple omics types, including phosphoproteomics, in pathway analysis is not supported.6 These methods are all useful for various purposes, but in practice, one generally needs to evaluate numerous approaches requiring a unified framework. Furthermore, none support data integration using phosphoproteomics data.
To simplify pathway analysis of multiple different types of data, including post-translational modification, we have developed a framework, the layered enrichment analysis of pathways in R (leapR), to represent multiple omics types, perform pathway analysis on the individual sets or combined sets, and analyze and represent the results in a biologically meaningful manner.
IMPLEMENTATION
The leapR package has functions for reading omics data in the form of data matrices, with rows indicating the molecular species and columns indicating the sample (treatment, condition, subject, etc.). For data types such as phosphoproteomics, the matrix contains additional information about the site of the modification. The package has a function (combine_omics) for merging different kinds of omics data to perform multiomics enrichment. A common interface combines multiple methods for functional enrichment (Table 1 and Figure 1), and the package includes a comprehensive vignette demonstrating their use on a previously published multiomics data set.7 This unified framework enables the ability to apply a t test, Fisher’s exact test, or a Kolgomorov-Smirnov test depending on the type of data and problem considered.
Table 1.
Enrichment Methods in leapR
| enrichment method | application |
|---|---|
| enrichment_comparison | Is pathway abundance different between the case and control? |
| enrichment_in_sets | Are pathway members over-represented in a subset? |
| enrichment_in_order | Are pathway members grouped in an ordered list? |
| correlation_enrichment | Are pathway members significantly correlated with each other? |
| enrichment_in_pathway | Is the pathway more abundant than the background? |
| enrichment_in_relationships | Are pathway members enriched in relationships (e.g., PPIs?) |
Figure 1.

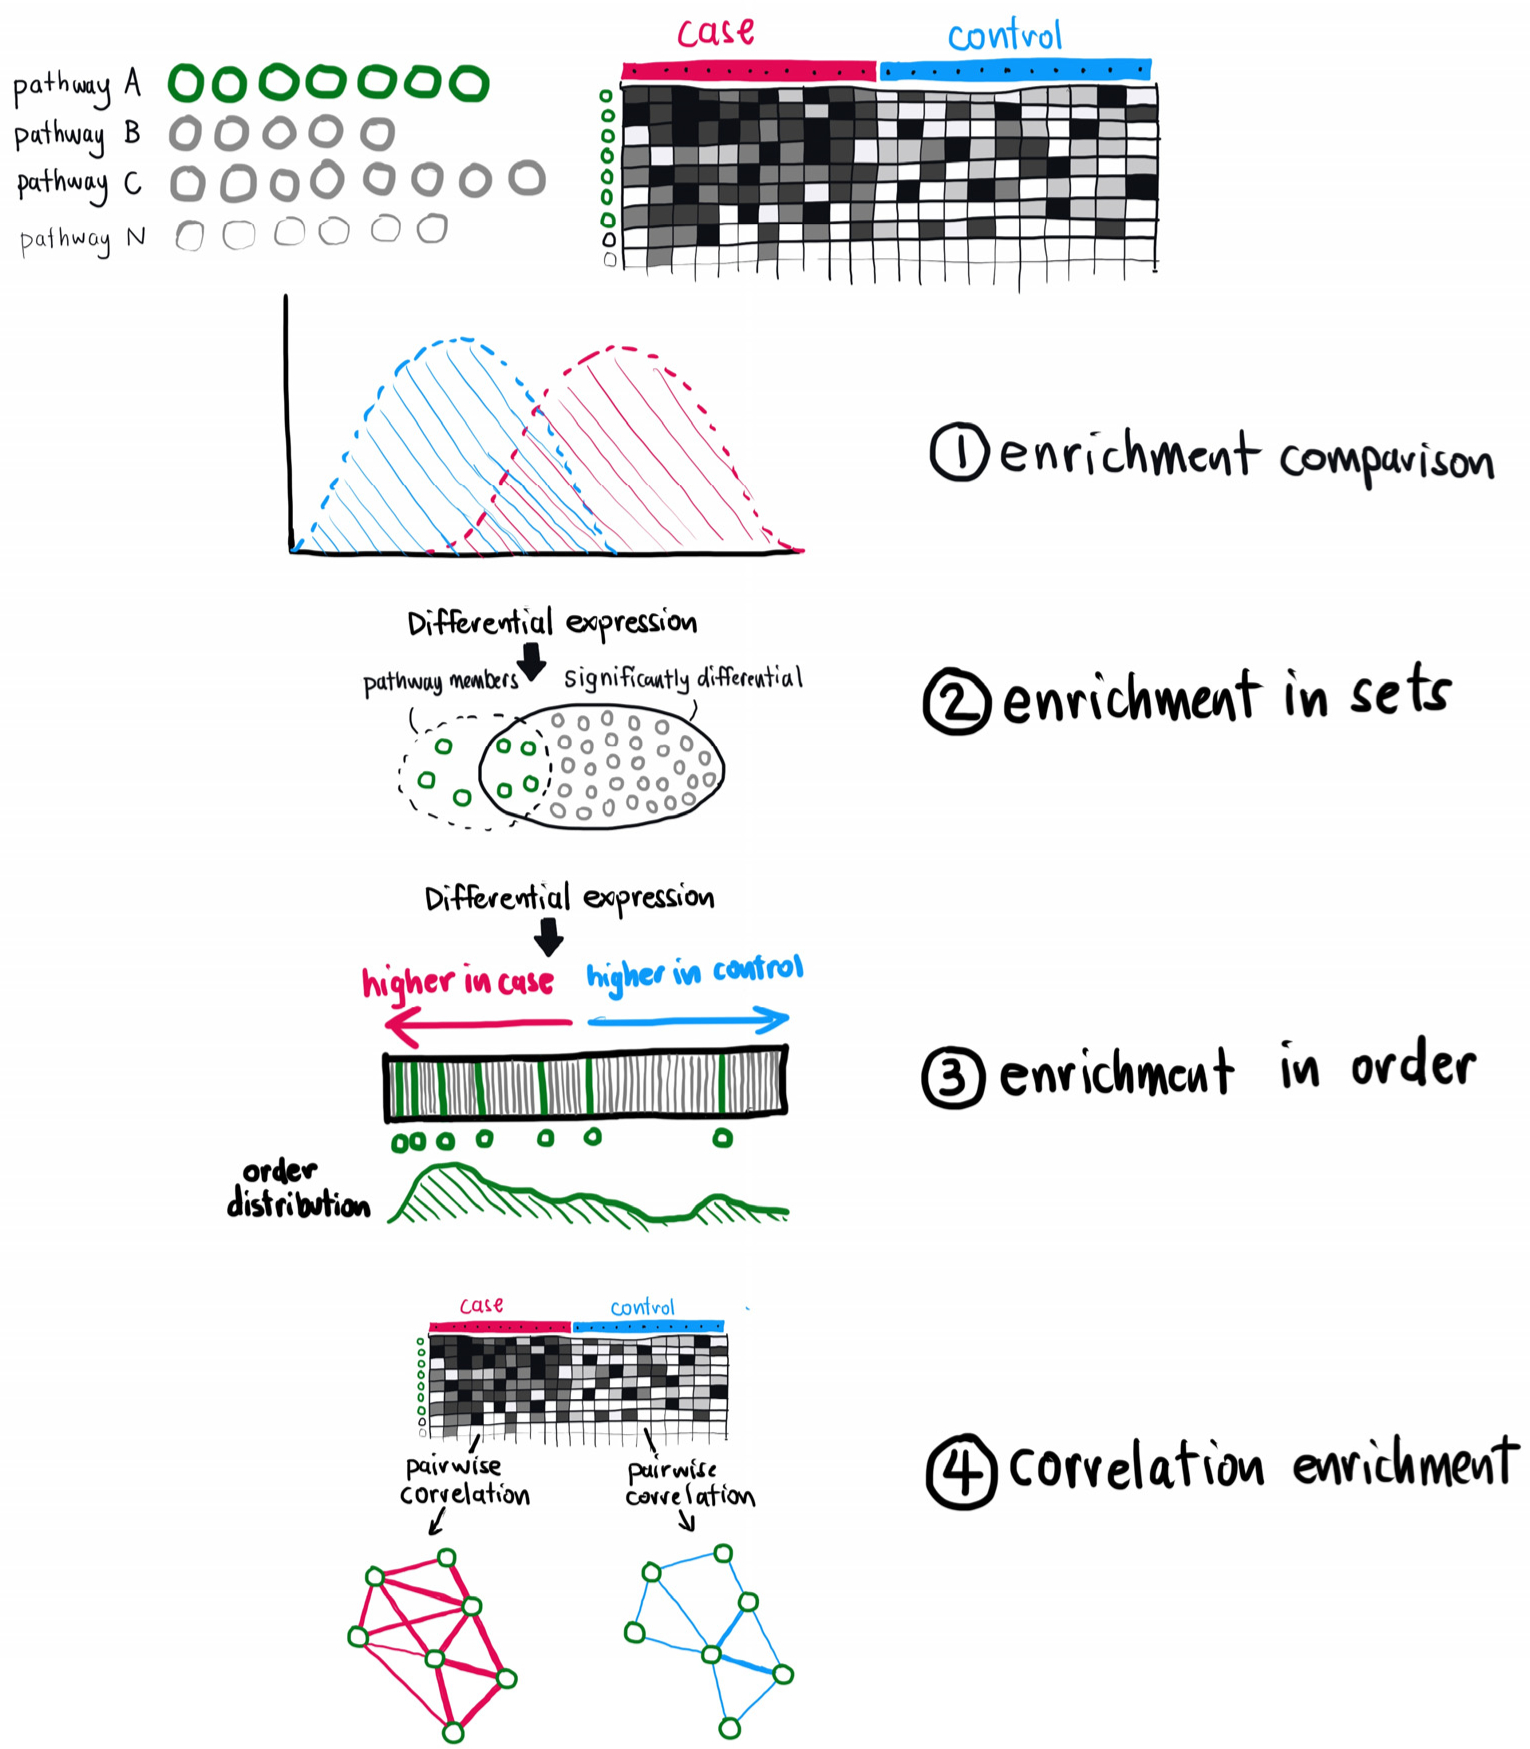
Graphical comparison of different enrichment methods described in the text. As described in the text, we illustrate the comparison between the case and control for pathway enrichment using four different approaches contained in the leapR package.
Because pathway analysis often requires testing of many hypotheses (one for each pathway), we also include standard multiple hypothesis correction methods for postprocessing as well as randomization methods for calculating the significance of results empirically. Support for phosphoproteomics incorporation into pathway enrichment is a key distinction of the package, and example uses are provided in the vignette.
Finally, we introduce a number of customized algorithms to examine pathway enrichment based on the correlation of pathway members across conditions, enrichment in interactions in pathways (e.g., from protein–protein interactions), and pathway-specific principle component analysis.
The collection of functions and algorithms provides a basis to analyze and interpret complex, multiomic data sets and link them with phenotypic outputs in the form of functional pathways.
The leapR package is available on GitHub at http://github.com/biodataganache/leapR or installation from R using devtools: “devtools::install_github(“biodataganache/leapR”)”.
RESULTS
The purpose of the leapR package is to enable the use of six distinct functional enrichment approaches together in a single R package. To this end, we have included a tutorial vignette that walks users through each of the enrichment approaches included in leapR, using the example multiomics data set included in the package and pathway data from commonly used sources. This analysis is laid out in the vignette included in the package, which can also serve as a template for user-directed analyses. Figure 1 and Table 1 summarize the six different functions, which are described in detail below. Figures 2 and 3 show example results from the package.
Figure 2.

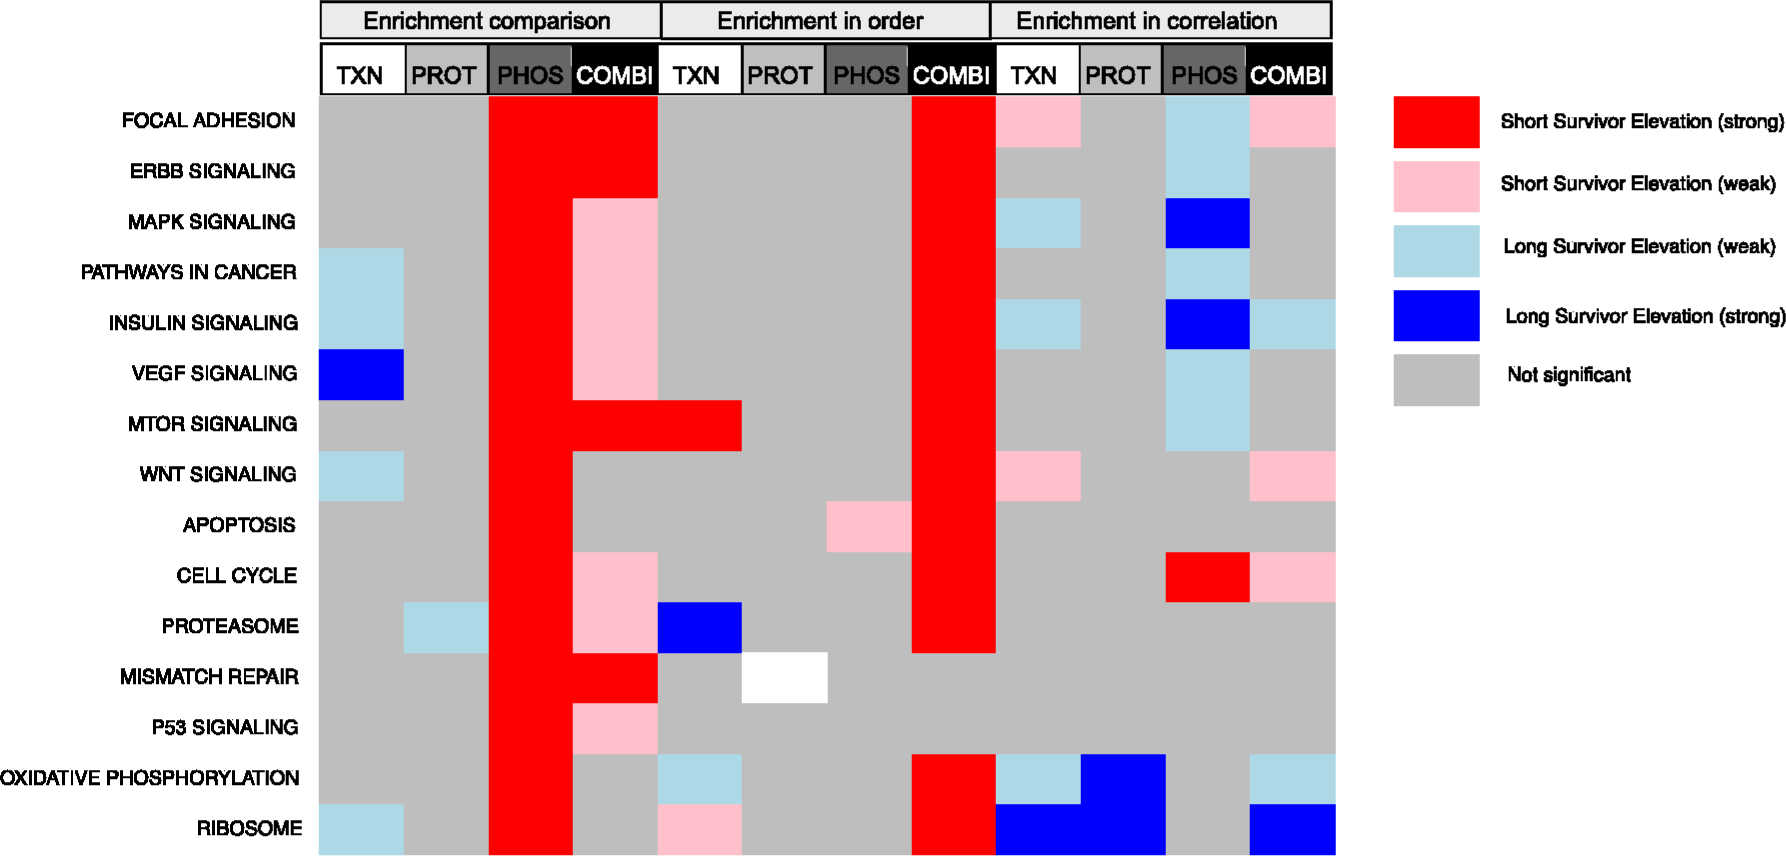
Comparison of different enrichment methods applied to an example data set. Enrichment methods (enrichment comparison, enrichment in order, and correlation enrichment) were applied to the indicated data types from our ovarian cancer data set; TXN, transcriptomics; PROT, proteomics; PHOS, phosphoproteomics; COMBI, merged omics from all three. Comparisons were performed based on a case (data from tumors from short surviving patients) versus control (data from tumors from long surviving patients). Colored cells represent significantly enriched pathways (adjusted p-value <0.05) with blue being enriched in long survivors and red being enriched in short survivors. A darker color indicates a larger effect size. Pathways (rows) were selected from cancer relevant pathways in KEGG. Enrichment in sets was applied using significantly differential molecules between the case and control but yielded no significant results for this example.
Figure 3.

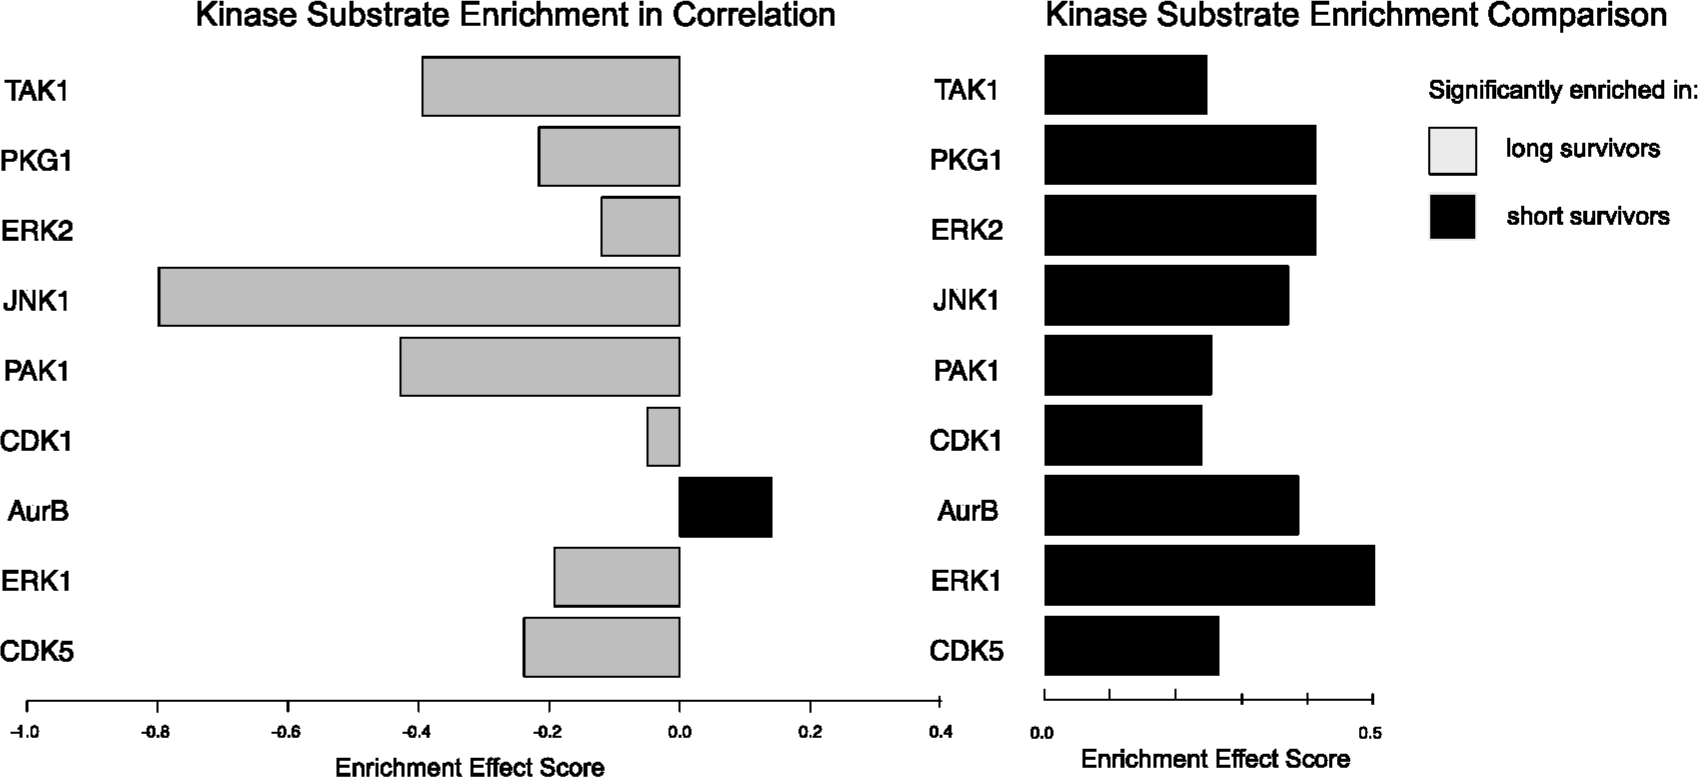
Enrichment methods applied to site-specific phosphorylation data. The differential enrichment score from two separate enrichment approaches is shown. On the left, significant pathways by differential correlation analysis are shown, and on the right, the same pathways showing an enrichment comparison between substrate phosphosite abundance are shown. Enrichment in the short surviving patient set is depicted in black bars, in the positive direction, and enrichment in long surviving patient set is depicted in gray bars, in the negative direction. Sets of known substrates for the kinases were derived from the Phosphosite Plus database. For demonstration purposes, significance of the correlation results was not corrected for multiple hypotheses. Comparing the two plots shows that although the kinase substrates are all significantly more abundant in the short surviving cohort, the long surviving cohort had a greater degree of correlation between those substrates—suggesting more controlled regulation.
Condition Comparison
Many applications of enrichment compare one group of samples (case) against another group (control) with the goal of identifying pathways that have significantly different abundance in this comparison. The leapR package accomplishes this in the enrichment_comparison (see Figure 1 and Table 1) using a t test in which the overall abundance of the pathway members is summarized in distributions for the case and control groups and then compared. Output from this analysis will yield p-values for each input pathway that indicate the significance of enrichment. Examining the mean abundance from each condition will provide an idea of the effect size and the direction of enrichment—that is, is the pathway more abundant in the case or control condition? A small effect size can still yield very significant p-values, but these kinds of results must be treated with caution.
Protein Set Comparison
Another common application of enrichment analysis is to examine a list of genes or proteins to see if there is significant pathway enrichment, for example in the topmost differentially abundant proteins from the comparison discussed above. The Fisher’s exact test (analogous to the hypergeometric test as applied) can be used in this case to assess pathway enrichment in the set, relative to representation in the background list of all proteins identified. As with the condition comparison above, it is important to examine the results, because pathways with small numbers of members in the list can sometimes have very significant p-values, which may or may not be interesting depending on the question being posed.
Order-Based Enrichment
Instead of imposing a largely arbitrary threshold to perform a Fisher’s exact enrichment, the order of the entire list can be used to test for enrichment in pathways where the location of pathway members clusters together in terms of order (enrichment_in_order). This approach is flexible and requires only a way to rank the genes or proteins in the list. It uses the Kologmorov-Smirnov test, a version of which is also employed in the popular gene set enrichment analysis (GSEA) package.1 The method can be applied using any relative ranking metric: absolute abundance measure for a single sample, differential abundance measure (as in the previous two examples), or another metric such as correlation (see correlation example, below).
Enrichment in Correlation
A less-established approach for assessing the enrichment of pathways in a set of multiple samples is by testing if the genes or proteins within a pathway are more correlated than proteins outside the same pathway. This approach can compare case vs control sets to identifying pathways that exhibit more concordance in one set of conditions (case) versus another (control). Pathways that are more likely regulated are more likely to have proteins and genes that are correlated in expression values. Previous studies8,9 have demonstrated that differential correlation analysis works well at the level of individual genes and pathways but does not provide tools for large-scale analysis of pathway-based correlation and differential correlation, which is provided here. Combining this analysis with, e.g., pathways with significantly higher abundance in the case condition, provides a further filter on potential pathway activity. To our knowledge, leapR is the first framework that provides this capability for omics analysis.
Phosphoproteomics Pathway Enrichment
Proteomics performed on fractions enriched for phosphorylated peptides, or phosphoproteomics, has grown in popularity recently as a way to characterize signaling pathways and other functional changes effected by this common post-translational modification.10–12 The leapR package has two methods to perform enrichment on phosphoproteomics data. The first is an implementation of the previously described kinase substrate enrichment algorithm (KSEA).13 We include a current version of phosphorylation sites that is known to be substrates of specific kinases derived from the Phosphosite Plus and Networkin databases.14,15 Application of the ordered enrichment approach that considers specific sites on phosphoproteomic data will test for the enrichment of substrates for specific kinases (see the package Vignette for implementation details). Significant results indicate that the substrates for a kinase are more (or less) phosphorylated, indicating that the kinase is more (or less) active. We have previously studied this relationship in large-scale cancer data.12 The second method is to analyze the phosphoproteomics at the whole protein level to look for pathways that have significantly different levels of phosphorylation overall using any of the methods already described. This method provides an indication of pathway activity at the signaling level, and we have previously found this to be more effective at discriminating between patient groups in ovarian cancer than transcript or protein levels.7
Multiomic Pathway Enrichment
Analysis of pathway enrichment using data from multiple omics sources has been reported previously,3 and leapR provides capabilities for calculating enrichment using combinations of data types with each of the approaches described above. Though methods that take into account specific roles of different data types (transcript abundance might drive protein abundance, for example) have been developed, it is clear that the relationships between molecules measured are complicated. Therefore, our approach focuses on a role-agnostic approach to data integration, which treats the different types of data the same in the enrichment process. Though this is an oversimplification of the biology, we argue that it can be very useful to get an improved idea of how the system is responding generally. We show an example of this in the next section.
EXAMPLE PATHWAY ENRICHMENT
We include multiomics data from our ovarian cancer study7 in the leapR package to serve as an example of the various methods described above. The data set includes transcriptomics and global proteomics from resected tumors from 174 patients with high-grade serous ovarian cancer (HGSOC) and phosphoproteomics from a subset of 69 of these patients. Follow-up clinical data is available for each of the patients, and in our previous study, we separated the tumors into those with patients who survived for shorter times and those who survived for longer times to compare the molecular states of the two groups.7
We compared proteomics measurements between case (short survivors, n = 33) and control (long survivors, n = 37) in four different ways. The results, summarized in Figure 2, show important pathways and their statistical significance (adjusted p-value <0.05 is colored according to the key) under each of the different methods. We excluded the set comparison, as it yielded no significant results. The vignette contains details of these comparisons, but briefly: in condition comparison, we compared the abundance of all proteins in the pathway between the case and control groups; in the protein set comparison, we first calculated the difference between the case and control for each protein and then used the set of proteins with a significant adjusted p-value (p < 0.05) to test enrichment; in the protein order comparison, we used the difference between the case and control to order the proteins and tested for enrichment in order; in the correlation comparison, we used the correlation in the short surviving patients and compared it with the correlation in the long surviving patients. We repeated this analysis with the transcriptomics data and the phosphoproteomics data. Finally, we include a column that shows the same enrichment methods using the combined data set, which includes the transcriptomics, proteomics, and phosphoproteomics data. The results show that the different enrichment methods provide different results in terms of which pathways are found to be significant and, in a few cases, which direction the enrichment occurs in. We note that this application is on only one example data set, and other types of comparisons may yield different results—both in terms of how different enrichment methods work and what the different types of omics data reveal about the system. The distinct analysis approaches in leapR provide opportunities for distinct insights. The correlation-based approach indicates the how tightly regulated protein/gene expressions are, whereas the expression-based approaches indicate the magnitude in regulation of one group vs another, with the different approaches likely providing different sensitivity levels, and we have previously employed these methods in a number of publications to derive meaningful biological insight.11,16–18
We also identified kinase activity from the enrichment of known substrates in phosphoproteomics data in our test data set.16,17,19 We used two approaches, enrichment in correlation and enrichment comparison, to analyze the site-specific phosphoproteomics data to identify kinases that were significantly enriched comparing the short survivor cohort with the long survivor cohort. The results of this analysis are shown in Figure 3, which shows the enrichment score for each of nine kinases found to be significant by differential correlation analysis (note, for the purposes of this illustration, we considered the unadjusted p-values for significance, which is not recommended for actual applications). The results show that though the abundance of substrates for all of these kinases was found to be significantly increased in the short surviving cohort, and the correlation between substrates was significantly higher in the long surviving cohort. This indicates that though the phosphorylation abundance is higher in short survivor tumors (as we previously reported7), those same kinases might be more tightly regulated in long surviving tumors.
CONCLUSIONS
It is important to note that though data can be combined, it may not be appropriate to do so. The issues of interbatch or interdata set variability in meta-analyses are well documented,20 and caution must be taken when attempting to combine different data sets to ensure that appropriate batch correction has been performed prior to any enrichment. Failing to do so will likely result in spurious results that either increase variability and mask true signal or produce results that reflect technical differences rather than biological ones. Likewise, different data types from the same conditions must be carefully considered prior to use in multiomics enrichment such as that described here.
The rise in the ability to quickly and inexpensively assay the same samples using multiple different molecular profiling technologies has driven the need for improved methods for analyzing and integrating such multiomic data. Additionally, the biological insight provided by such data sets demonstrates the benefits of developing more sophisticated methods. We believe that the leapR package provides a useful and unique platform for representation and analysis of multiomic data sets.
ACKNOWLEDGMENTS
Analysis was conducted as part of the National Cancer Institute Clinical Proteomic Tumor Analysis Consortium (CPTAC) under grants U01CA214116 and U24CA210955 and under the Laboratory Directed Research and Development Program at Pacific Northwest National Laboratory, a multi-program national laboratory operated by Battelle for the U.S. Department of Energy under Contract DE-AC05-76RL01830.
Footnotes
The authors declare no competing financial interest.
Complete contact information is available at: https://pubs.acs.org/10.1021/acs.jproteome.0c00963
Contributor Information
Vincent Danna, Computational Biology Group, Pacific Northwest National Laboratory, Richland, Washington 99352, United States.
Hugh Mitchell, Computational Biology Group, Pacific Northwest National Laboratory, Richland, Washington 99352, United States.
Lindsey Anderson, Computational Biology Group, Pacific Northwest National Laboratory, Richland, Washington 99352, United States.
Iobani Godinez, Computational Biology Group, Pacific Northwest National Laboratory, Richland, Washington 99352, United States.
Sara J. C. Gosline, Computational Biology Group, Pacific Northwest National Laboratory, Richland, Washington 99352, United States.
Justin Teeguarden, Environmental Molecular Sciences Laboratory, Pacific Northwest National Laboratory, Richland, Washington 99352, United States.
Jason E. McDermott, Computational Biology Group, Pacific Northwest National Laboratory, Richland, Washington 99352, United States; Department of Molecular Microbiology and Immunology, Oregon Health & Sciences University, Portland, Oregon 97201, United States.
REFERENCES
- (1).Subramanian A; et al. Gene set enrichment analysis: a knowledge-based approach for interpreting genome-wide expression profiles. Proc. Natl. Acad. Sci. U. S. A. 2005, 102, 15545–15550. [DOI] [PMC free article] [PubMed] [Google Scholar]
- (2).Huang DW; Sherman BT; Lempicki RA Bioinformatics enrichment tools: paths toward the comprehensive functional analysis of large gene lists. Nucleic Acids Res. 2009, 37,1–13. [DOI] [PMC free article] [PubMed] [Google Scholar]
- (3).Tiong KL; Yeang CH MGSEA - a multivariate Gene set enrichment analysis. BMC Bioinf. 2019, 20, 145. [DOI] [PMC free article] [PubMed] [Google Scholar]
- (4).Odom GJ; Ban Y; Colaprico A; Liu L; Silva TC; Sun X; Pico AR; Zhang B; Wang L; Chen X PathwayPCA: an R/Bioconductor Package for Pathway Based Integrative Analysis of Multi-Omics Data. Proteomics 2020, 20, 1900409. [DOI] [PMC free article] [PubMed] [Google Scholar]
- (5).Paczkowska M; et al. Integrative pathway enrichment analysis of multivariate omics data. Nat. Commun. 2020, 11, 735. [DOI] [PMC free article] [PubMed] [Google Scholar]
- (6).Liao Y; Wang J; Jaehnig EJ; Shi Z; Zhang B WebGestalt 2019: gene set analysis toolkit with revamped UIs and APIs. Nucleic Acids Res. 2019, 47, W199–W205. [DOI] [PMC free article] [PubMed] [Google Scholar]
- (7).Zhang H; et al. Integrated Proteogenomic Characterization of Human High-Grade Serous Ovarian Cancer. Cell 2016, 166, 755–765. [DOI] [PMC free article] [PubMed] [Google Scholar]
- (8).Fukushima A DiffCorr: an R package to analyze and visualize differential correlations in biological networks. Gene 2013, 518, 209–214. [DOI] [PubMed] [Google Scholar]
- (9).McKenzie AT; Katsyv I; Song WM; Wang M; Zhang B DGCA: A comprehensive R package for Differential Gene Correlation Analysis. BMC Syst. Biol. 2016, 10, 106. [DOI] [PMC free article] [PubMed] [Google Scholar]
- (10).Mertins P; et al. Ischemia in tumors induces early and sustained phosphorylation changes in stress kinase pathways but does not affect global protein levels. Mol. Cell Proteomics 2014, 13, 1690–1704. [DOI] [PMC free article] [PubMed] [Google Scholar]
- (11).McDermott JE; Arshad OA; Petyuk VA; Fu Y; Gritsenko MA Proteogenomic Characterization of Ovarian HGSC Implicates Mitotic Kinases, Replication Stress in Observed Chromosomal Instability. Cell Rep. Med 2020, 1, 100004. [DOI] [PMC free article] [PubMed] [Google Scholar]
- (12).Arshad OA; et al. An Integrative Analysis of Tumor Proteomic and Phosphoproteomic Profiles to Examine the Relationships Between Kinase Activity and Phosphorylation. Molecular & Cellular Proteomics 2019, 18, S26–S36. [DOI] [PMC free article] [PubMed] [Google Scholar]
- (13).Wiredja DD; Koyuturk M; Chance MR The KSEA App: a web-based tool for kinase activity inference from quantitative phosphoproteomics. Bioinformatics 2017, 33, 3489. [DOI] [PMC free article] [PubMed] [Google Scholar]
- (14).Hornbeck PV; Chabra I; Kornhauser JM; Skrzypek E; Zhang B PhosphoSite: A bioinformatics resource dedicated to physiological protein phosphorylation. Proteomics 2004, 4, 1551–1561. [DOI] [PubMed] [Google Scholar]
- (15).Linding R; et al. NetworKIN: a resource for exploring cellular phosphorylation networks. Nucleic Acids Res. 2007, 36, D695–699. [DOI] [PMC free article] [PubMed] [Google Scholar]
- (16).Cuesta R; et al. Phosphoproteome Analysis Reveals Estrogen-ER pathway as a modulator of mTOR activity via DEPTOR. Mol. Cell Proteomics 2019, 18, 1607. [DOI] [PMC free article] [PubMed] [Google Scholar]
- (17).Hosseini MM; et al. Inhibition of interleukin-1 receptor-associated kinase-1 is a therapeutic strategy for acute myeloid leukemia subtypes. Leukemia 2018, 32, 2374–2387. [DOI] [PMC free article] [PubMed] [Google Scholar]
- (18).Vasaikar S Proteogenomic Analysis of Human Colon Cancer Reveals New Therapeutic Opportunities. Cell 2019, 177, 1035–1049. [DOI] [PMC free article] [PubMed] [Google Scholar]
- (19).Arshad OA; et al. An Integrative Analysis of Tumor Proteomic and Phosphoproteomic Profiles to Examine the Relationships Between Kinase Activity and Phosphorylation. Mol. Cell Proteomics 2019, 18, S26–S36. [DOI] [PMC free article] [PubMed] [Google Scholar]
- (20).Leek JT; et al. Tackling the widespread and critical impact of batch effects in high-throughput data. Nat. Rev. Genet. 2010, 11, 733–739. [DOI] [PMC free article] [PubMed] [Google Scholar]


