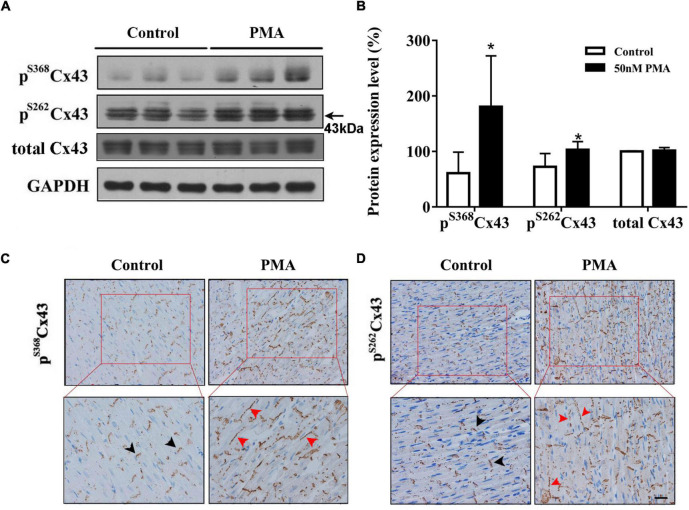
FIGURE 2.
Short-time PMA perfusion increased phosphorylation of Cx43 at serine 368 and serine 262 and its redistribution in isolated hearts. (A) Western blot images showing pS368Cx43 and pS262Cx43 levels were increased after PMA perfusion (30 min). (B) Corresponding statistical data. (C,D) Immunohistochemical analysis of pS368Cx43 and pS262Cx43 expression and redistribution (Bar = 20 μm). The black arrows indicate normal Cx43 in the intercalated disc, and red arrows indicate Cx43 lateralization after PMA perfusion. Error bars represent mean ± SD, n = 3 for each group. *p < 0.05 vs. control (KH perfusion).

