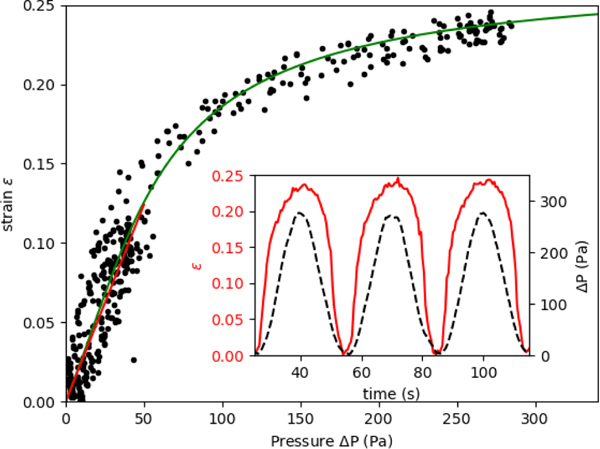
Fig. 3.
Measured strain of vessel compared to the applied pressure in sine wave function with period 60 s. Black circles show measured values on single vessel over multiple cycles for Sine waves with amplitude of 50 Pa and 300 Pa. The fitted response to Eq. 2 is shown in solid green. The fitted parameters are of membrane elasticity μm = μh = 7.5 kPa μm and the maximum strain εmax=0.27. The linear elastic response is shown in red from (0 to 50) Pa with a membrane elasticity of 22.6 kPa μm. (Inset) Timeseries showing variation in applied pressure and measured vessel deformation.

