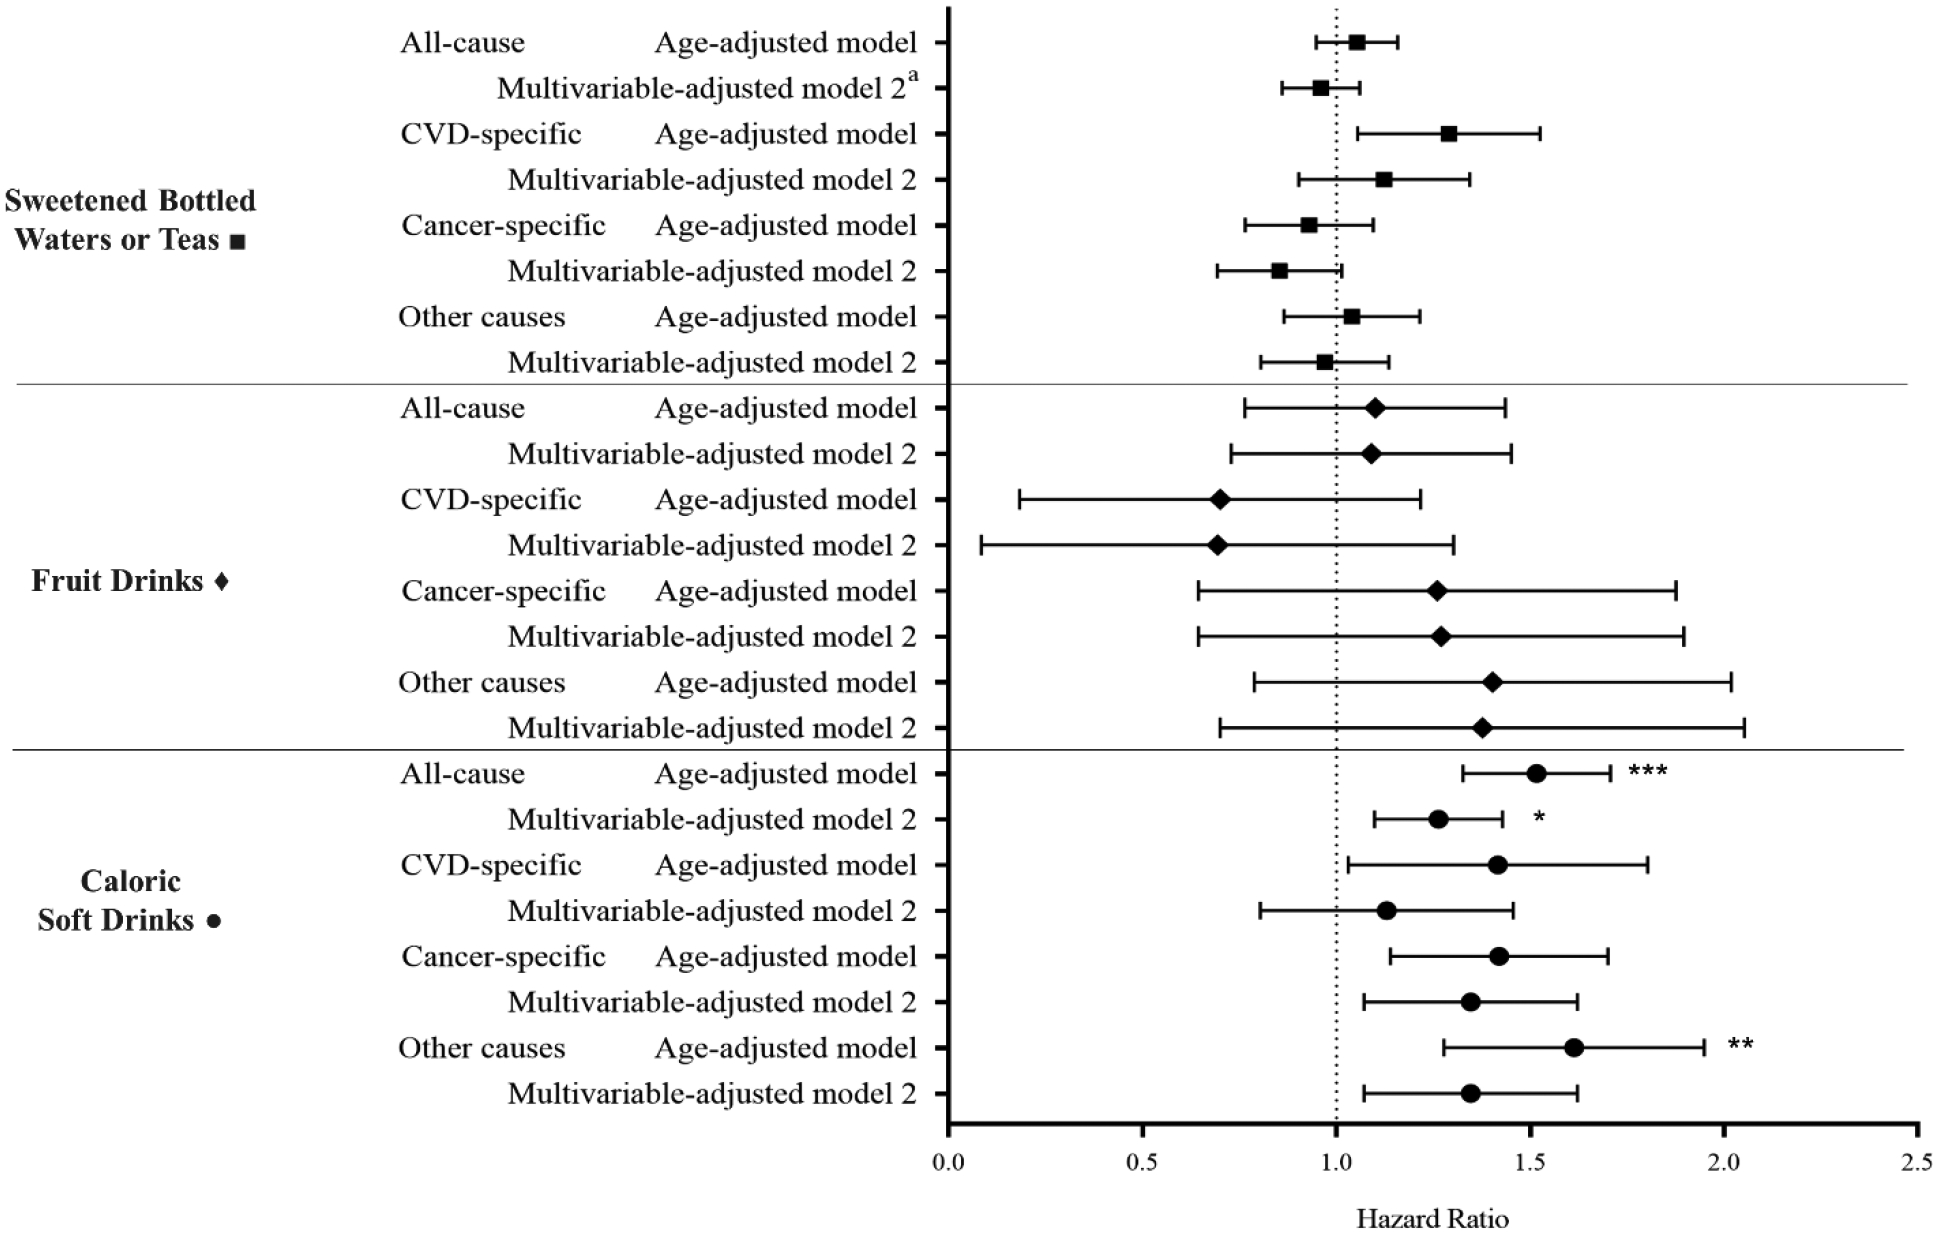
Figure 1.

Association of specific sugar- sweetened beverage consumption and mortality risk. Hazard ratios comparing ≥7 sugar- sweetened beverage servings per week vs rare/never (reference) categories. Multivariable- adjusted (model 2) adjusted for: age, race/ethnicity, socioeconomic status, marital status, smoking status, alcohol intake, history of hypertension, physical activity, aspirin use, menopausal status, menopausal hormone therapy use, use of at least one anti-hypertensive medication, oral contraceptive use, body mass index, total energy, and intakes of fruit and vegetable, red meat, processed meat, fish, refined carbohydrates, dietary fiber, and coffee/tea beverage, and consumption of sugar- sweetened bottled waters or teas, fruit drinks, and caloric soft drinks (other than the main exposure, depending on model). *P for trend statistical significance at P<0.05. **P for trend statistical significance at P<0.01. *** P for trend statistical significance at P<0.0001.
