Figure 3.

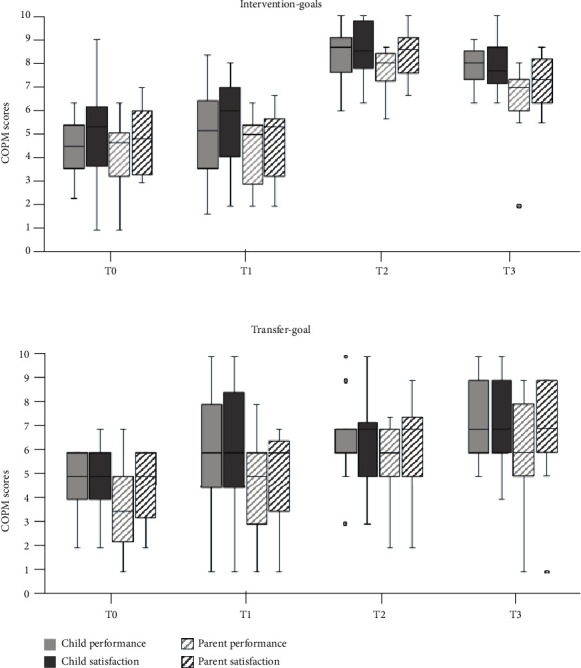
Changes in Canadian Occupational Performance Measure (COPM) scores over time for the intervention goals and transfer goal separately. The boxplots show the median, the first and third quartile, the range, and the outliers.

Changes in Canadian Occupational Performance Measure (COPM) scores over time for the intervention goals and transfer goal separately. The boxplots show the median, the first and third quartile, the range, and the outliers.