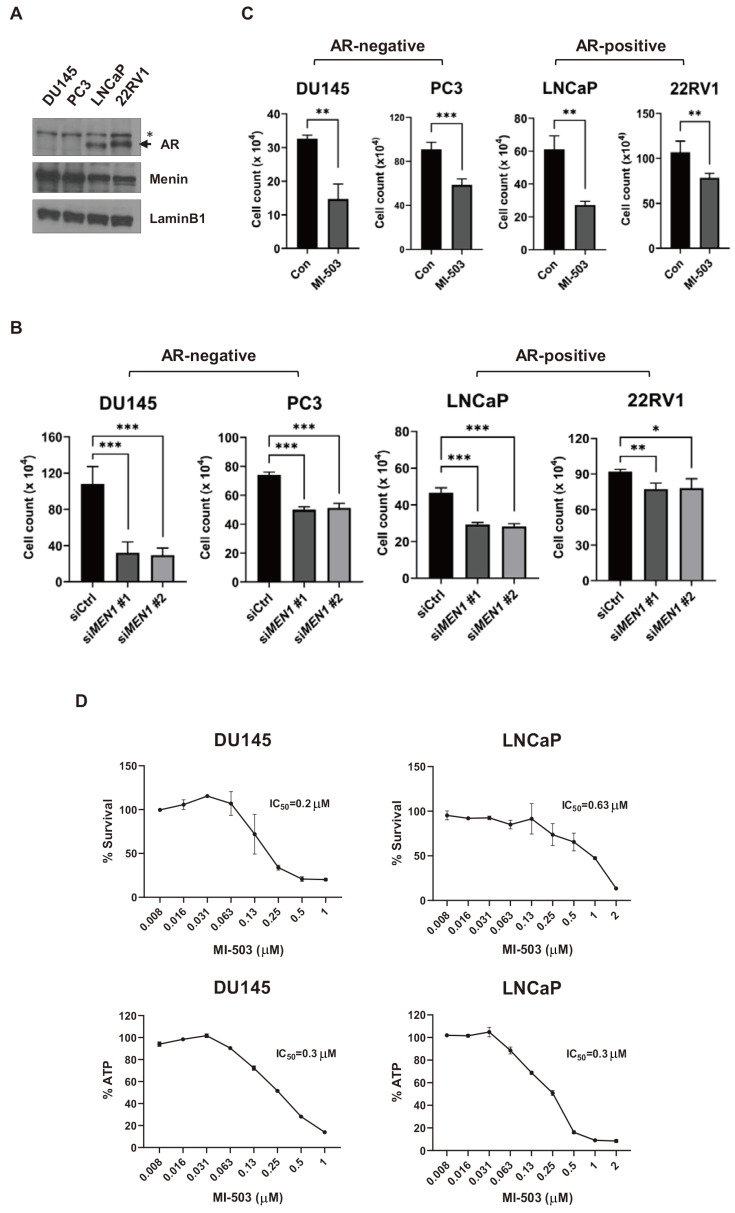
Fig. 1. Inhibition of menin represses the growth of both AR-positive and AR-negative PCa cells.
(A) Western blot assay of AR and menin in PCa cells. Lamin B1 (70 kDa) was used as a loading control. The AR protein band is indicated by an arrow. An asterisk indicates nonspecific bands. (B) The proliferation of DU145, PC3, LNCaP, and 22RV1 cells upon MEN1 knockdown for 48 h as measured by Trypan blue assay. *P < 0.05; **P < 0.01; ***P < 0.001. (C) Cell proliferation analysis of DU145, PC3, LNCaP, and 22RV1 cells treated with 1 μM of MI-503 for 48 h. **P < 0.01; ***P < 0.001. Con, control. (D) Proliferation of DU145 and LNCaP cells treated with different concentrations of MI-503 for 96 h. The IC50 value was measured using CCK-8 (upper) and CellTiter-Glo (below) methods.

