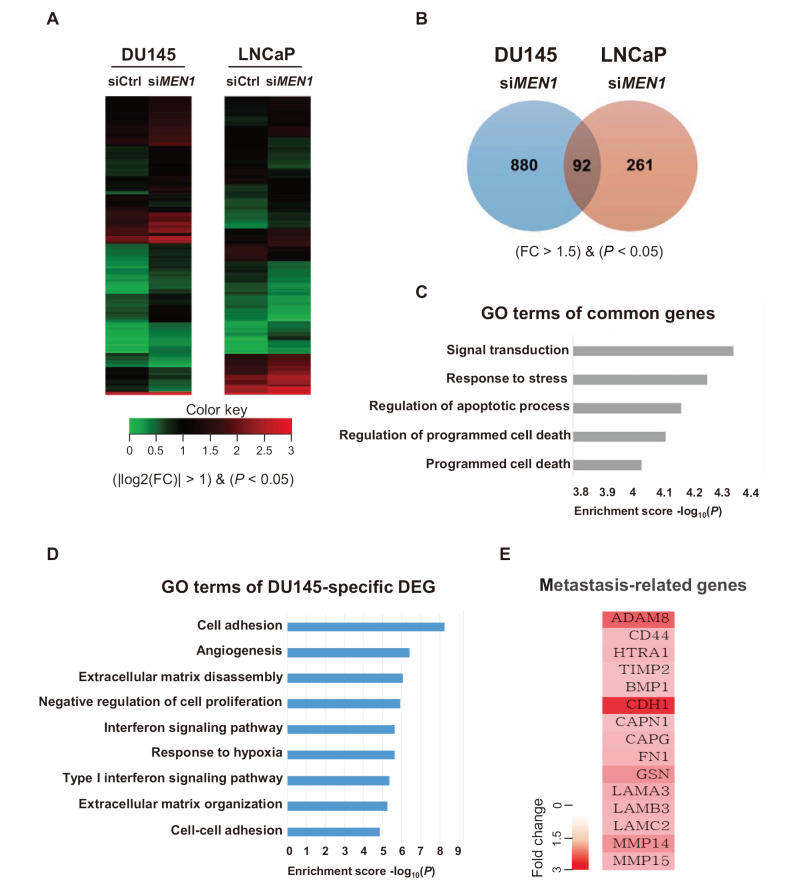
Fig. 3. GO analysis of DEGs with menin-depleted PCa cells.
(A) Heatmaps of DEGs from siMEN1-treated DU145 and LNCaP cells. (B) The expression of 972 and 353 genes was altered in MEN1 knockdown DU145 and LNCaP cells, respectively. The expression profiles of 92 genes were common in DU145 and LNCaP cells. Genes whose expression was changed by MEN1 knockdown (>1.5-fold) are shown. (C) A diagram showing the GO of 92 genes ordered by P value. The biological functions of genes with the five lowest P values are shown. (D) Biological process analysis was performed using DAVID to select upregulated genes (P < 0.05, FC > 2). (E) Representative genes affected by menin and associated with the metastatic pathway.

