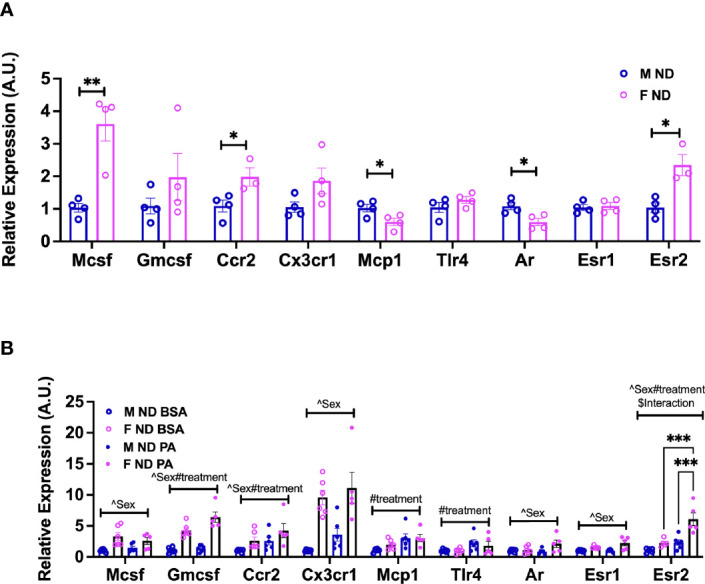
Figure 6.

Sex differences in the gene expression of monocyte markers upon stimulation with a SFA and chemokine. BM male and female monocyte gene expression of Mcsf, Gcsf, Ccr2, Cx3cr1, Mcp1, Tlr4, Ar, Esr1, and Esr2 from (A) 13-week-old mice. Data were analyzed by two-sample t-test. (B) 22-week-old mice. N = 4–6 per condition. Data were analyzed by 2-way ANOVA followed by Tukey’s multiple comparisons test. Data shown as average +/- SEM. *p<0.05, **p<0.01 and ***p<0.005. Figures are marked for significance of main effects (^sex or #treatment) and $interaction.
