FIGURE 3.

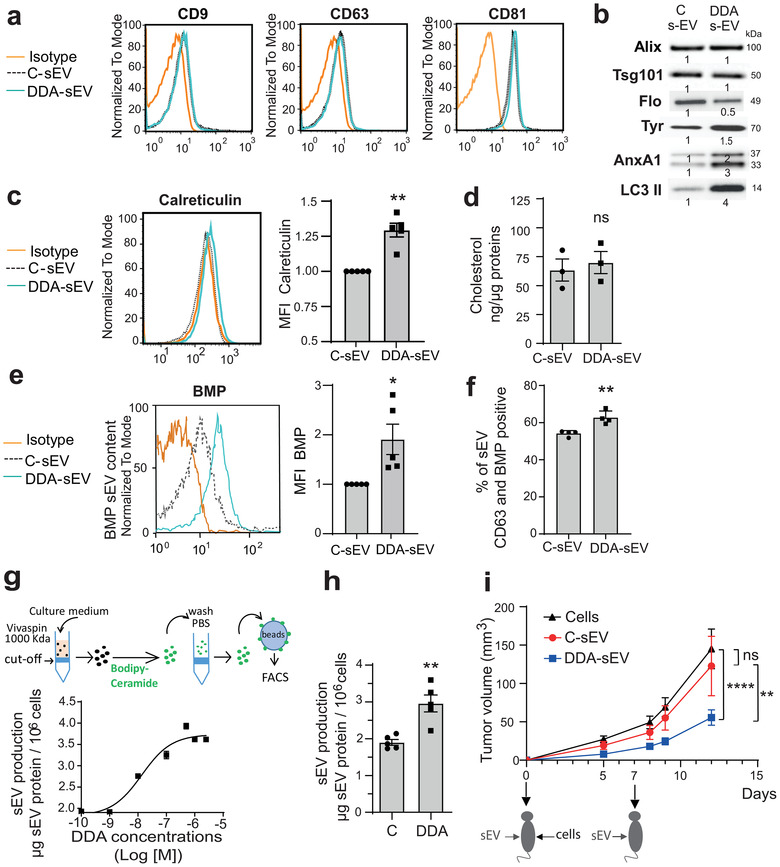
Characterization of sEV secreted from control‐ or DDA‐treated B16F10 cells. Analysis of sEV isolated from the culture media of B16F10 cells treated with the solvent vehicle (C‐sEV) or DDA (DDA‐sEV) for 24 h. (a) Representative flow cytometry analysis of sEV tetraspanin content (n = 3). (b) Representative immunoblot analysis of markers of sEV (Alix, Tsg101, Flotilin (Flo), LC3 II, Annexin A1 (AnxA1) and the melanocytic marker tyrosinase (Tyr) (n = 3) with densitometry values showing changes in protein expression relative to C‐sEV and normalized to Alix. (c) Representative flow cytometry analysis of sEV calreticulin content (n = 5). (d) GC/MS analysis of cholesterol content in sEV (n = 3). (e) Representative flow cytometry analysis of BMP quantification in sEV (n = 5). (f) Immunocapture of CD63‐positive sEV with an anti‐CD63 antibody fixed to beads and analysis of the presence of BMP in CD63‐positive sEV by flow cytometry analysis (n = 4). Data is expressed as percentage of positive beads and are the mean ± SEM of four independent experiments (*P < 0.05, t test, two‐tailed). (g) Quantification of sEV production from B16F10 cells, treated with increasing concentrations of DDA, monitored after sEV labelling with the lipid membrane probe bodipy‐ceramide as described in the schematic diagram, (n = 3). (h) sEV production recovered from 106 cells was measured by measuring protein content (n = 5). (i) Mice (15/group) were implanted with B16F10 tumour cells in the right flank and treated two times, at day 0 and day 7, in the contralateral flank with PBS or with 2 μg of C‐sEV or DDA‐sEV. Mean tumour volumes (± SEM) are shown, two‐way ANOVA, **P < 0.01, ****P < 0.0001. ns: not significant. Data are representative of three independent experiments. The plots in (c) and (e) show the median fluorescence intensity (MFI) of DDA‐ sEV relative to C‐sEV. Data in c, d, e, g, h are the means ± SEM of 3–5 independent experiments (*P < 0.05 and **P < 0.01, t test, two‐tailed; ns: not significant)
