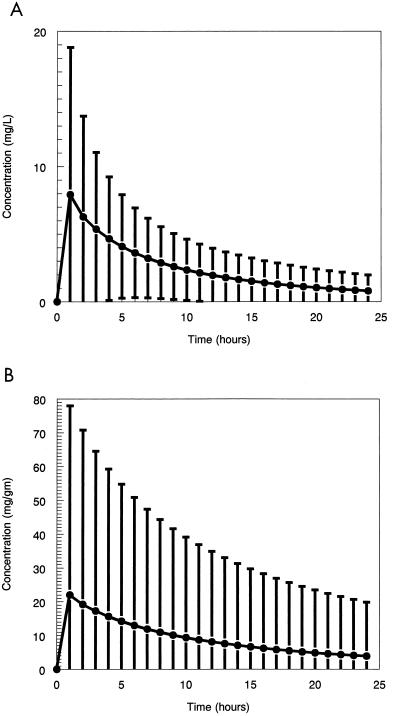
FIG. 3.
(A) Mean concentration-time curve in plasma and the 95% confidence interval derived from a Monte Carlo simulation. ●, drug concentration in plasma. (B) Mean concentration-time curve in the prostate and the 95% confidence interval derived from a Monte Carlo simulation. ●, drug concentration in prostate.

