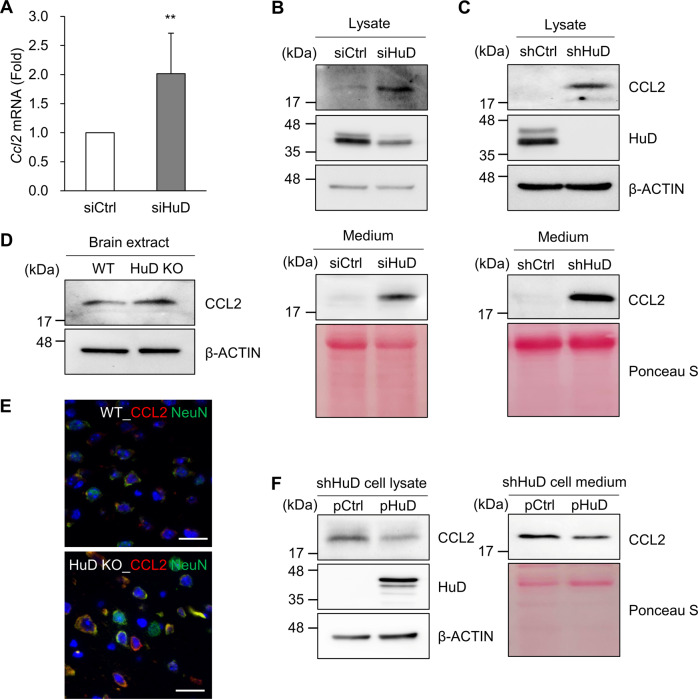
Fig. 3. Augmented expression of CCL2 by HuD knockdown.
A Following the transfection of N2a cells with either control siRNA or HuD siRNA, the expression of Ccl2 mRNA was determined via RT-qPCR. Gapdh mRNA was used for normalization. B, C The relative levels of CCL2 protein in both lysates (top) and culture media (bottom) were assessed via western blotting analysis in siRNA transfected cells (B) and stable cells (C). D, E Endogenous CCL2 levels in the brain of HuD KO mice and age-matched WT mice were assessed via western blotting analysis (D) and immunofluorescence microscopy (E). n = 3, Red: CCL2, green: NeuN, blue: nuclei. Scale bar, 20 μm. F N2a_shHuD cells were transiently transfected with plasmids (pHuD or control plasmid) and CCL2 levels in both lysates and media were determined by western blotting analysis. β-ACTIN blot and Ponceau S staining were used as loading controls. Images are representative, and data indicate the mean ± SEM from three independent experiments. The statistical significance of the data was analyzed via Student’s t-test; **p < 0.01.

