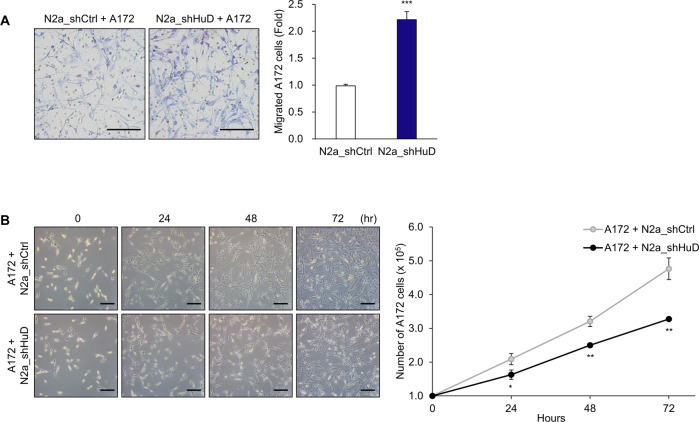
Fig. 6. Alterations in migration and growth of A172 cells co-cultured with N2a_shHuD cells.
A A172 cells (upper chamber) and N2a cells (lower chambers) were co-cultured for 48 h and migration of A172 cells were determined by staining of migrated cells on the transwell membrane. B A172 cells (lower chamber) and N2a cells (upper chambers) were co-cultured and the number of A172 cells was analyzed by cell counting at each time point. Images are representative, and data indicate the mean ± SEM derived from three independent experiments. Scale bar, 200 μm. The statistical significance of the data was analyzed via Student’s t-test; *p < 0.05; **p < 0.01; ***p < 0.001.

